How to use Shopwise
Enter your numbers each month and you get a management report. This guide goes step by step, from creating a store to reading the report.
1. Create your store
Add a store
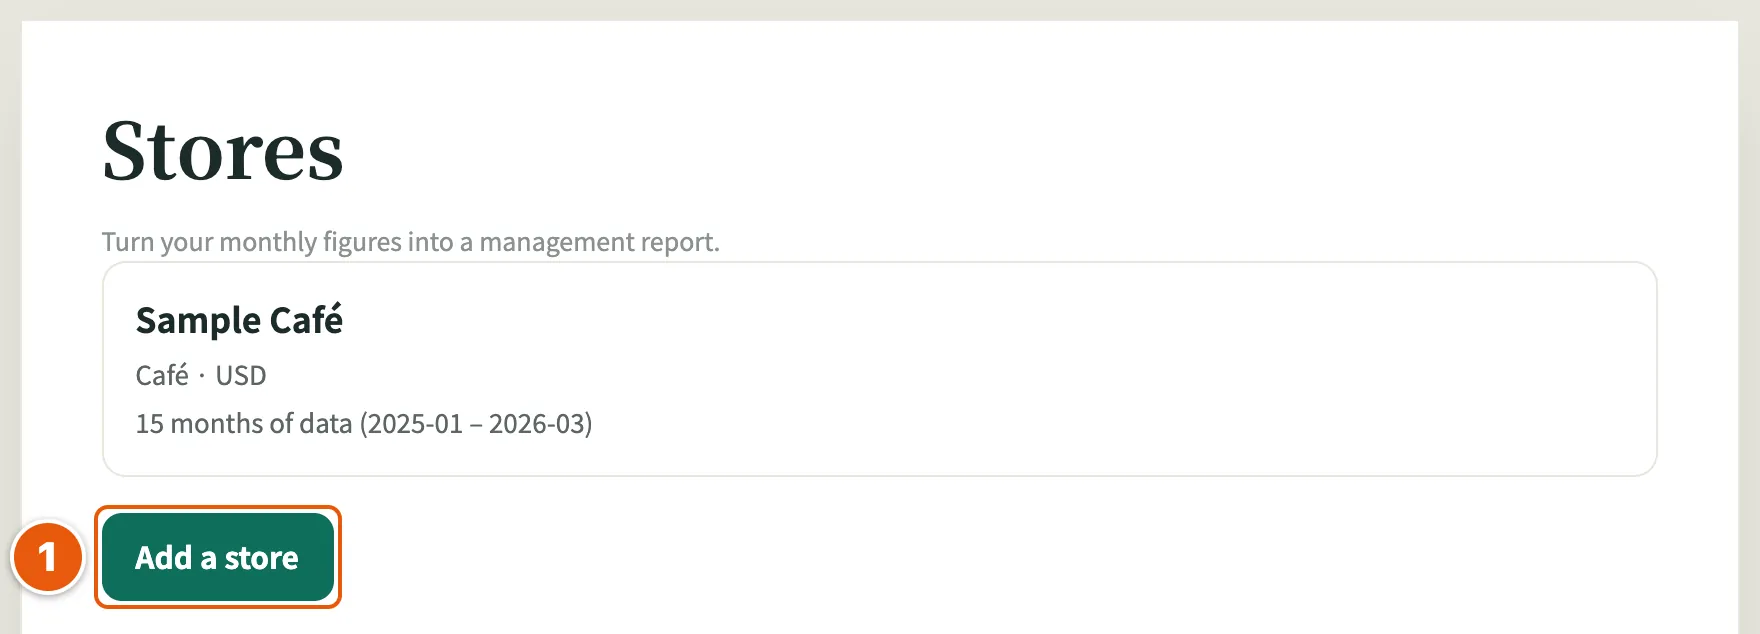
- On the "Stores" page, press "Add a store" to start setting up a new store.
Fill in the store
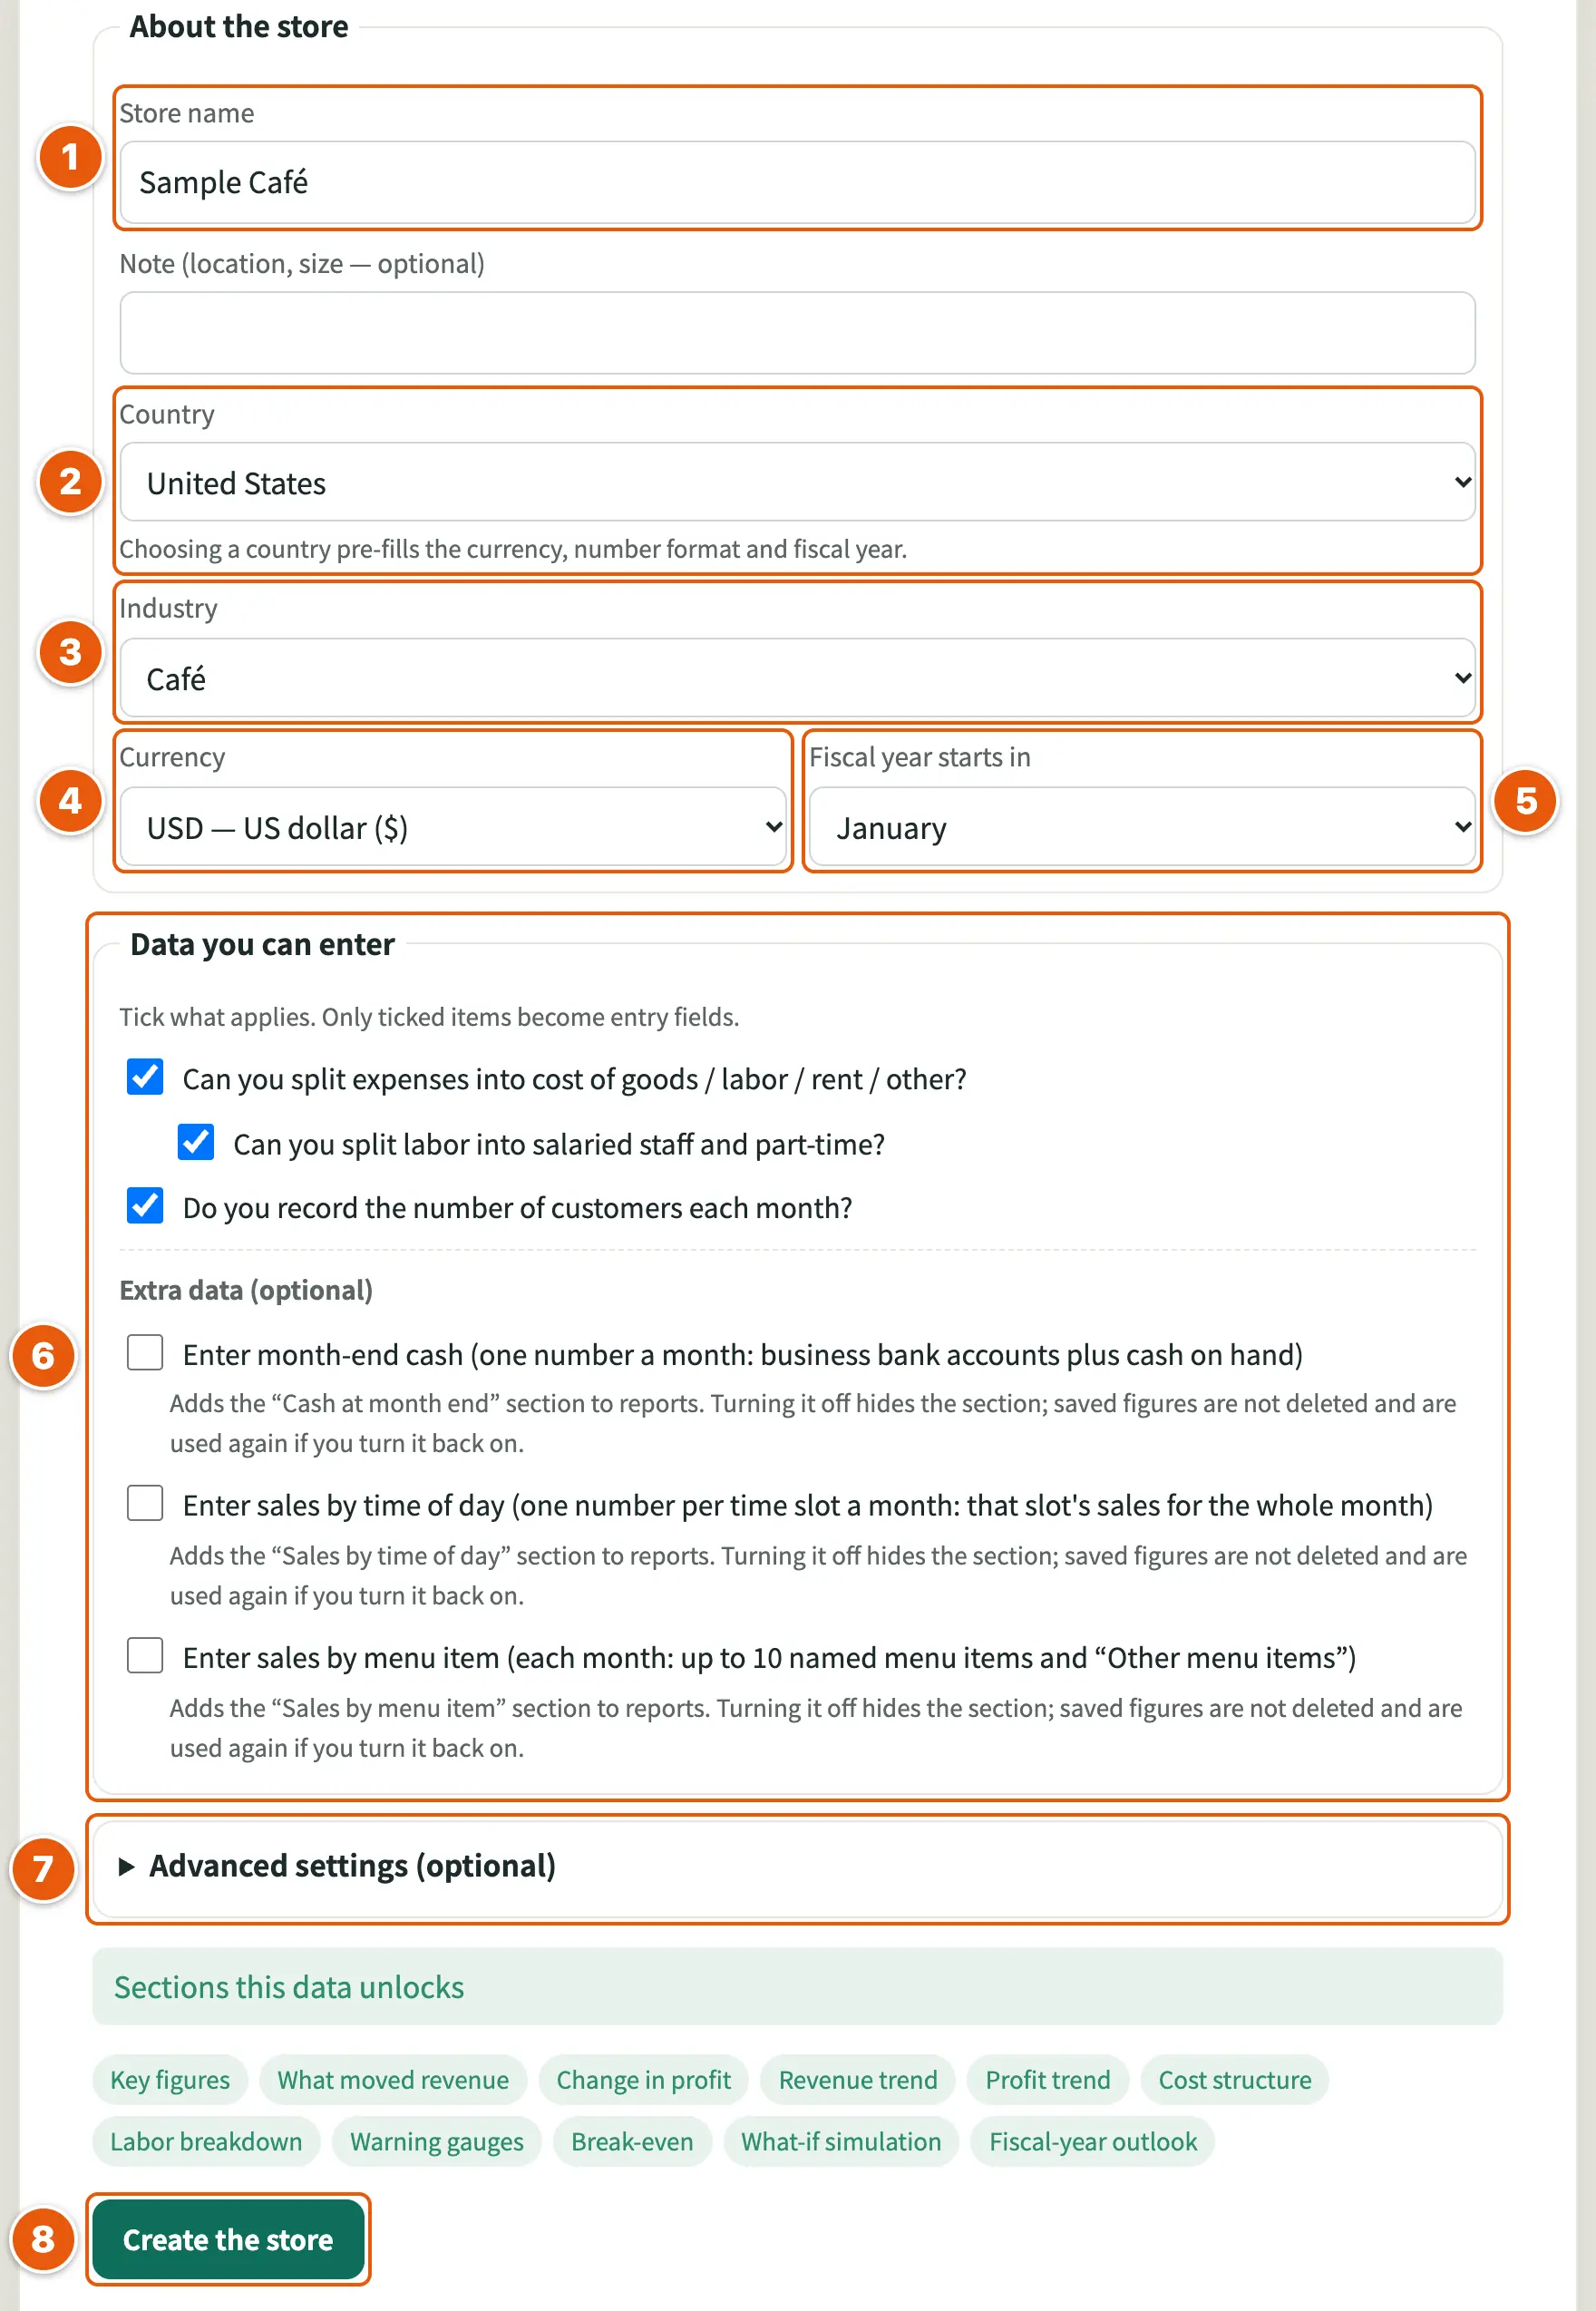
- "Store name": the name shown at the top of your reports.
- "Country": pre-fills the currency, number format and fiscal year.
- "Industry": guide values and some wording in the report follow your industry.
- "Currency": you enter amounts in this currency.
- "Fiscal year starts in": the fiscal-year outlook counts from this month.
- "Data you can enter": tick what applies to the data you keep. Only ticked items become entry fields: whether you can split expenses by category, split labor into salaried staff and part-time, and whether you record customers each month. If you can't split something, you enter the total, and the sections that need the split are left out of the report. Turning on month-end cash under "Extra data (optional)" adds the "Cash at month end" section to reports; turning it off hides the section, and saved figures are not deleted. Turning on sales by time of day asks for 2 to 6 time slots, each with a name and its hours; if you later change the number of time slots or their hours, the new time slots apply from the following month, and months with different time slots are not compared. Turning on sales by item (shown as menu items, products or services depending on the industry) asks for up to 10 names with the largest sales; renaming keeps the figures already entered, and figures of items you stop entering are kept.
- "Advanced settings (optional)": you can leave "Fixed share of other expenses", "Average part-time hourly wage" and "Days open per week" blank to start; blank fields use an estimate. Your own values make the break-even point and simulations fit your store. With "Days open per week", the break-even point in customers is also shown per day.
- "Create the store": creates the store.
To change this later, open "Store settings" with "Change settings" on the store page.
Delete a store
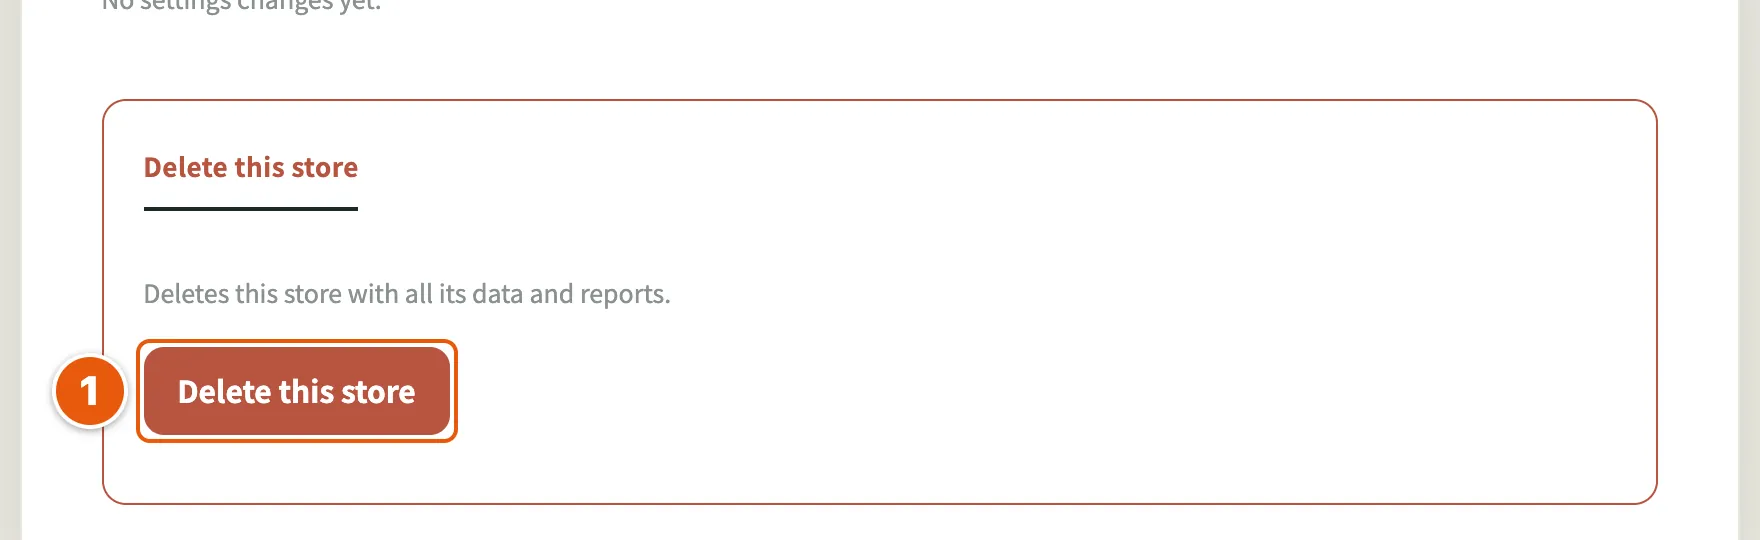
- "Delete this store": at the bottom of "Store settings". It opens the check before deleting.
Demo stores cannot be deleted (use "Reset the demo stores" to restore them).
Before the store is deleted
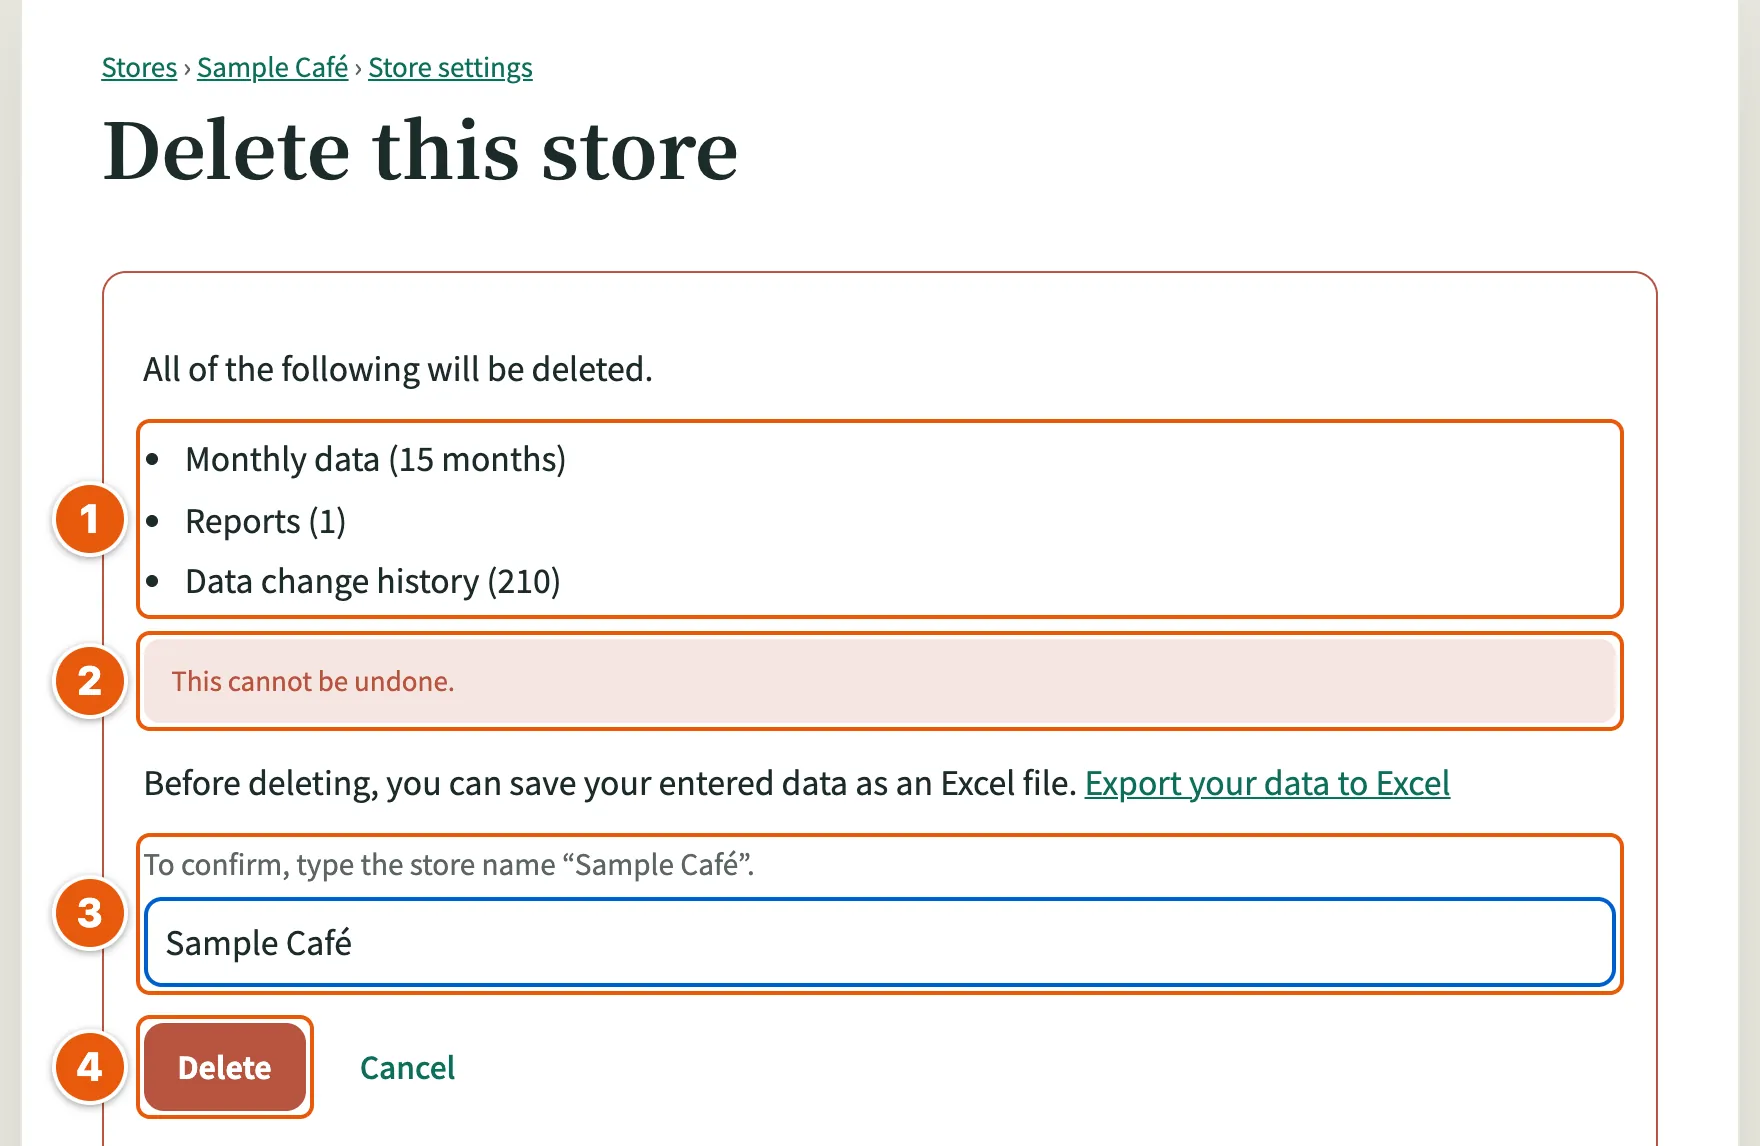
- What will be deleted: the monthly data, reports, change history, unsaved drafts and files stored for imports, with counts.
- "This cannot be undone.": a deleted store cannot be restored.
- "Store name": type the store name exactly, to confirm.
- "Delete": works only once the name matches. The store is deleted and you return to the store list.
Before deleting, you can save your data with "Export your data to Excel" (chapter 2).
2. Enter your numbers
Three ways
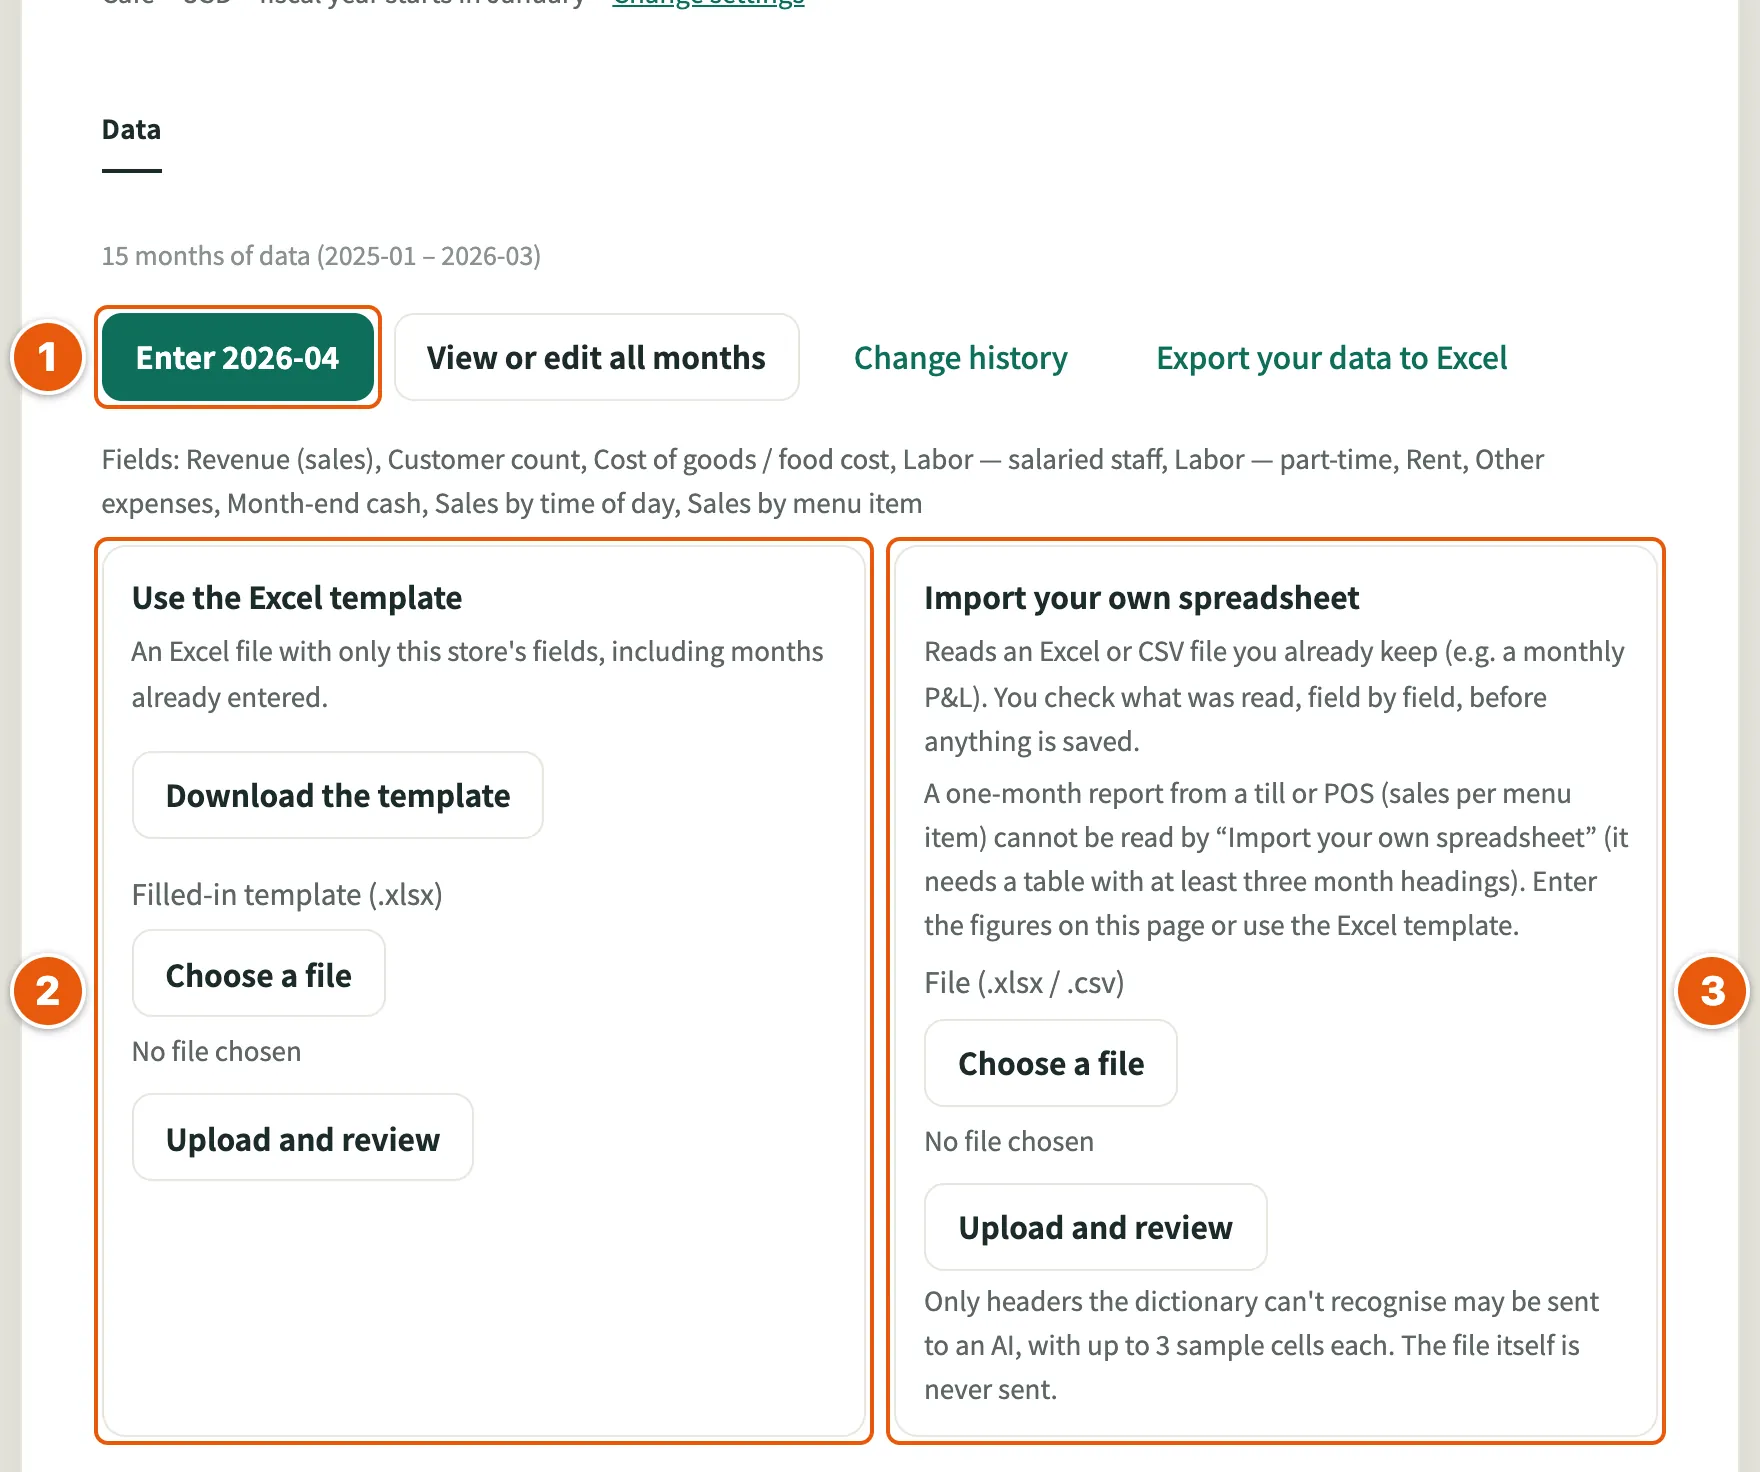
- On screen: press the button for the next month (e.g. "Enter 2026-04") and type that month's numbers.
- "Use the Excel template": "Download the template" gives you a file with only this store's fields. Fill it in, pick it with "Choose a file" and press "Upload and review".
- "Import your own spreadsheet": pick an Excel or CSV file you already keep (e.g. a monthly P&L) with "Choose a file" and press "Upload and review".
Every way shows a check screen before anything is saved.
Type in your numbers
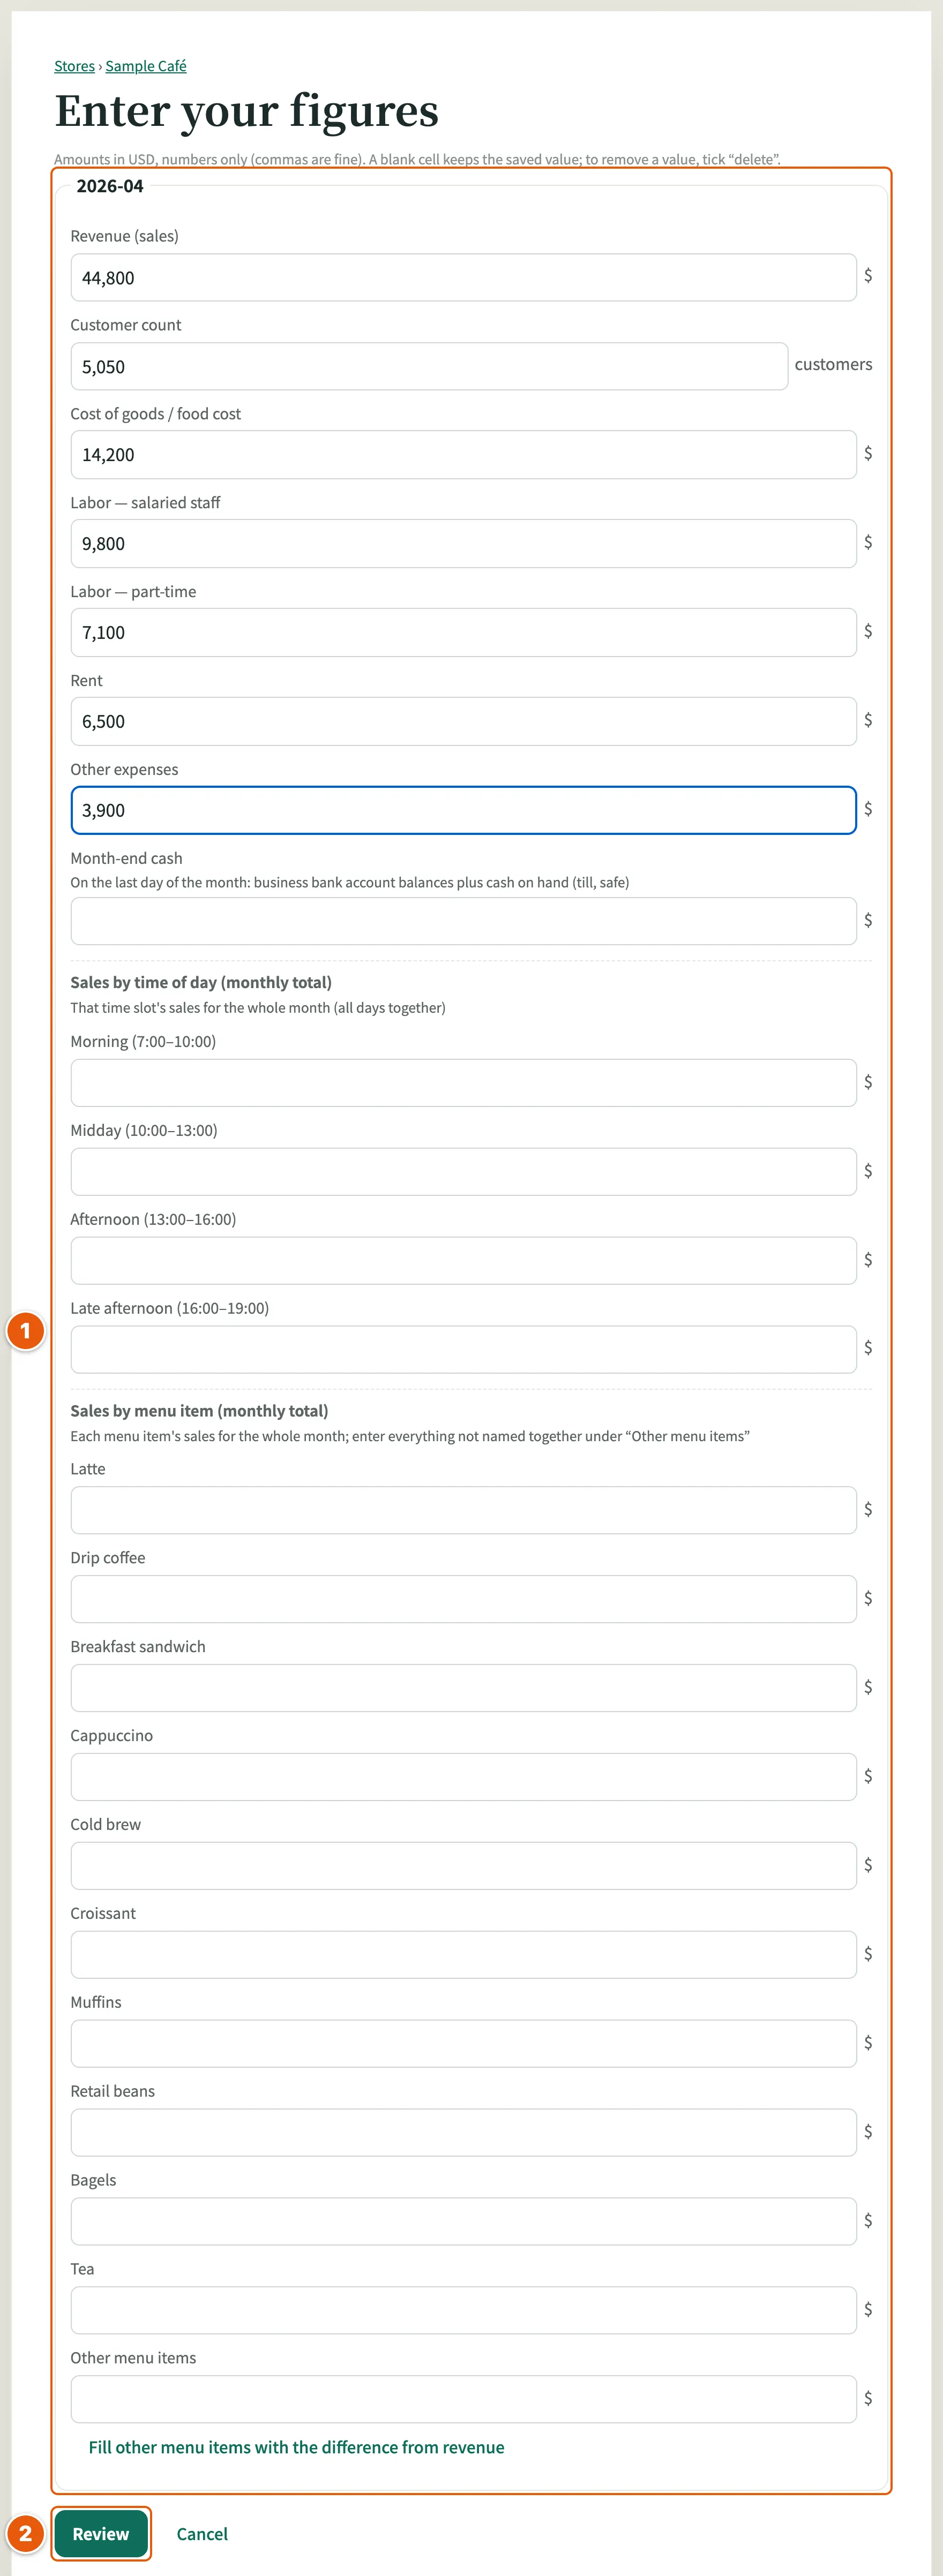
- Amount and customer fields: numbers only (commas are fine).
- "Review": goes to the check screen. Nothing is saved yet.
Stores with month-end cash turned on also have that field: one number a month, the business bank account balances plus cash on hand (till, safe) on the last day of the month. The Excel template has that column only while it is turned on.
Stores with sales by time of day turned on also have "Sales by time of day (monthly total)": for each time slot, enter that slot's sales for the whole month (all days together). If the time slots do not add up to revenue, you are asked to confirm before saving, and the figures are used as entered.
Stores with sales by item turned on enter each named item's sales for the month and the sales of "Other items". "Fill other items with the difference from revenue" (the word for items depends on the industry) puts revenue minus the named items into "Other items" — only when you press it, and not when the named items add up to more than revenue. If the total differs from revenue, you are asked to confirm before saving. A one-month report from a till or POS cannot be read by "Import your own spreadsheet"; enter those figures on this page or in the Excel template.
Check before saving
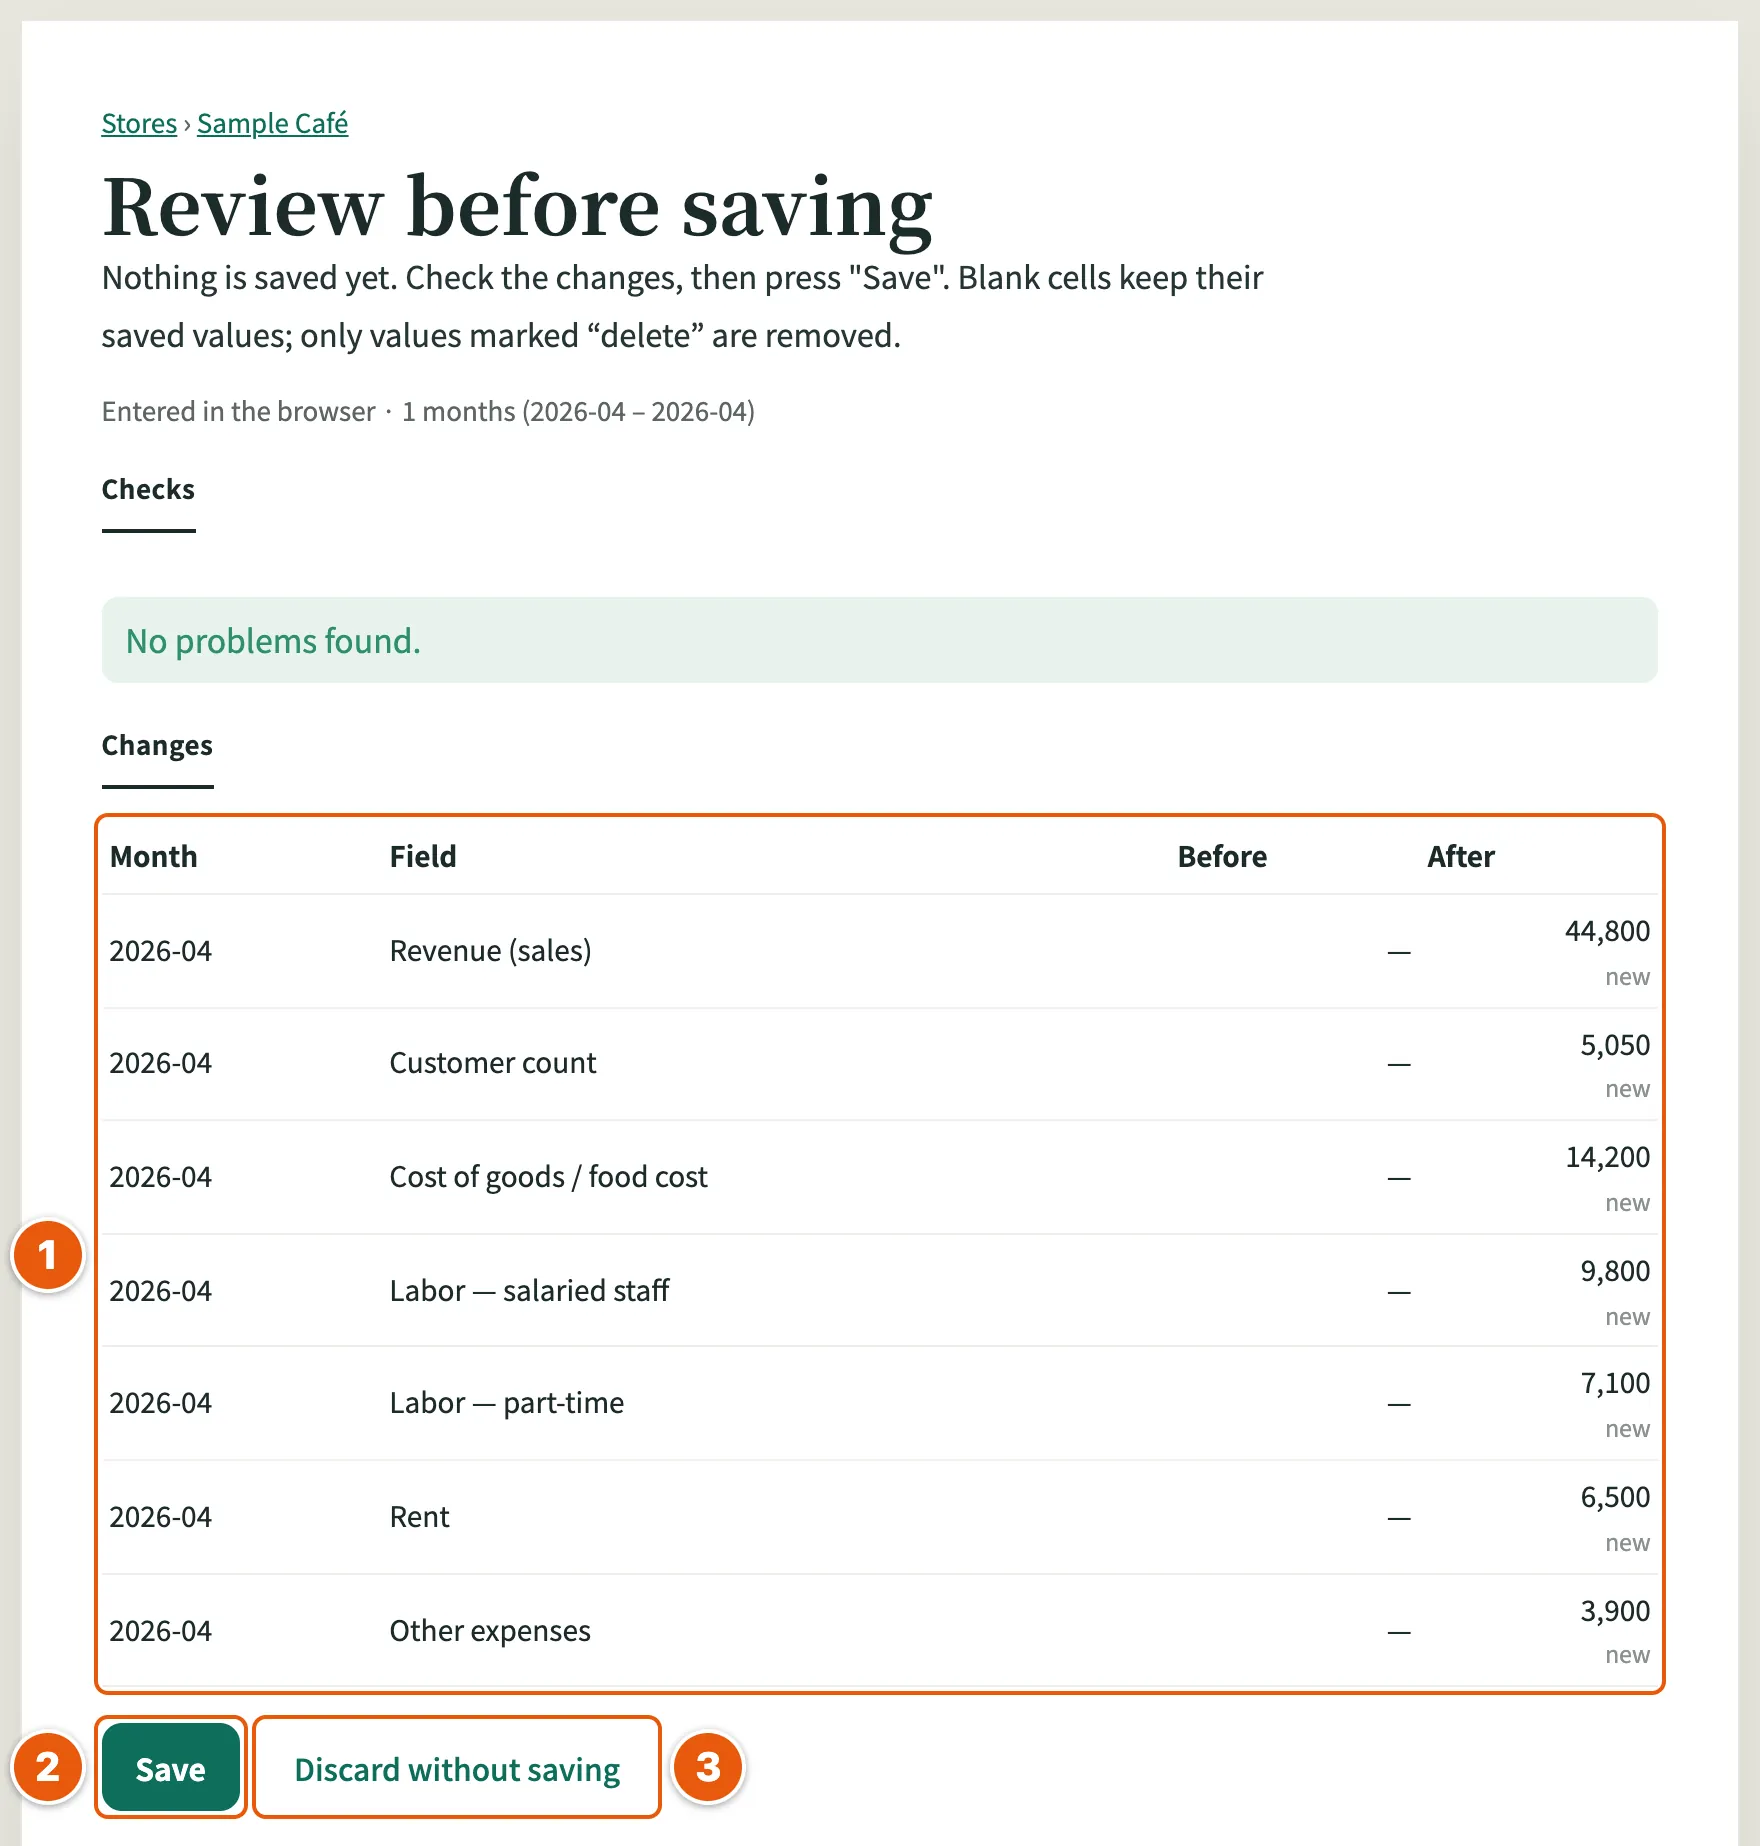
- "Changes": the values to be added, changed or removed.
- "Save": nothing is saved until you press it.
- "Discard without saving": stops without saving anything.
If a month in between is left out, "Checks" shows a warning. You can still save, but the report for the month after it will not show comparisons with the previous month.
When you import a spreadsheet
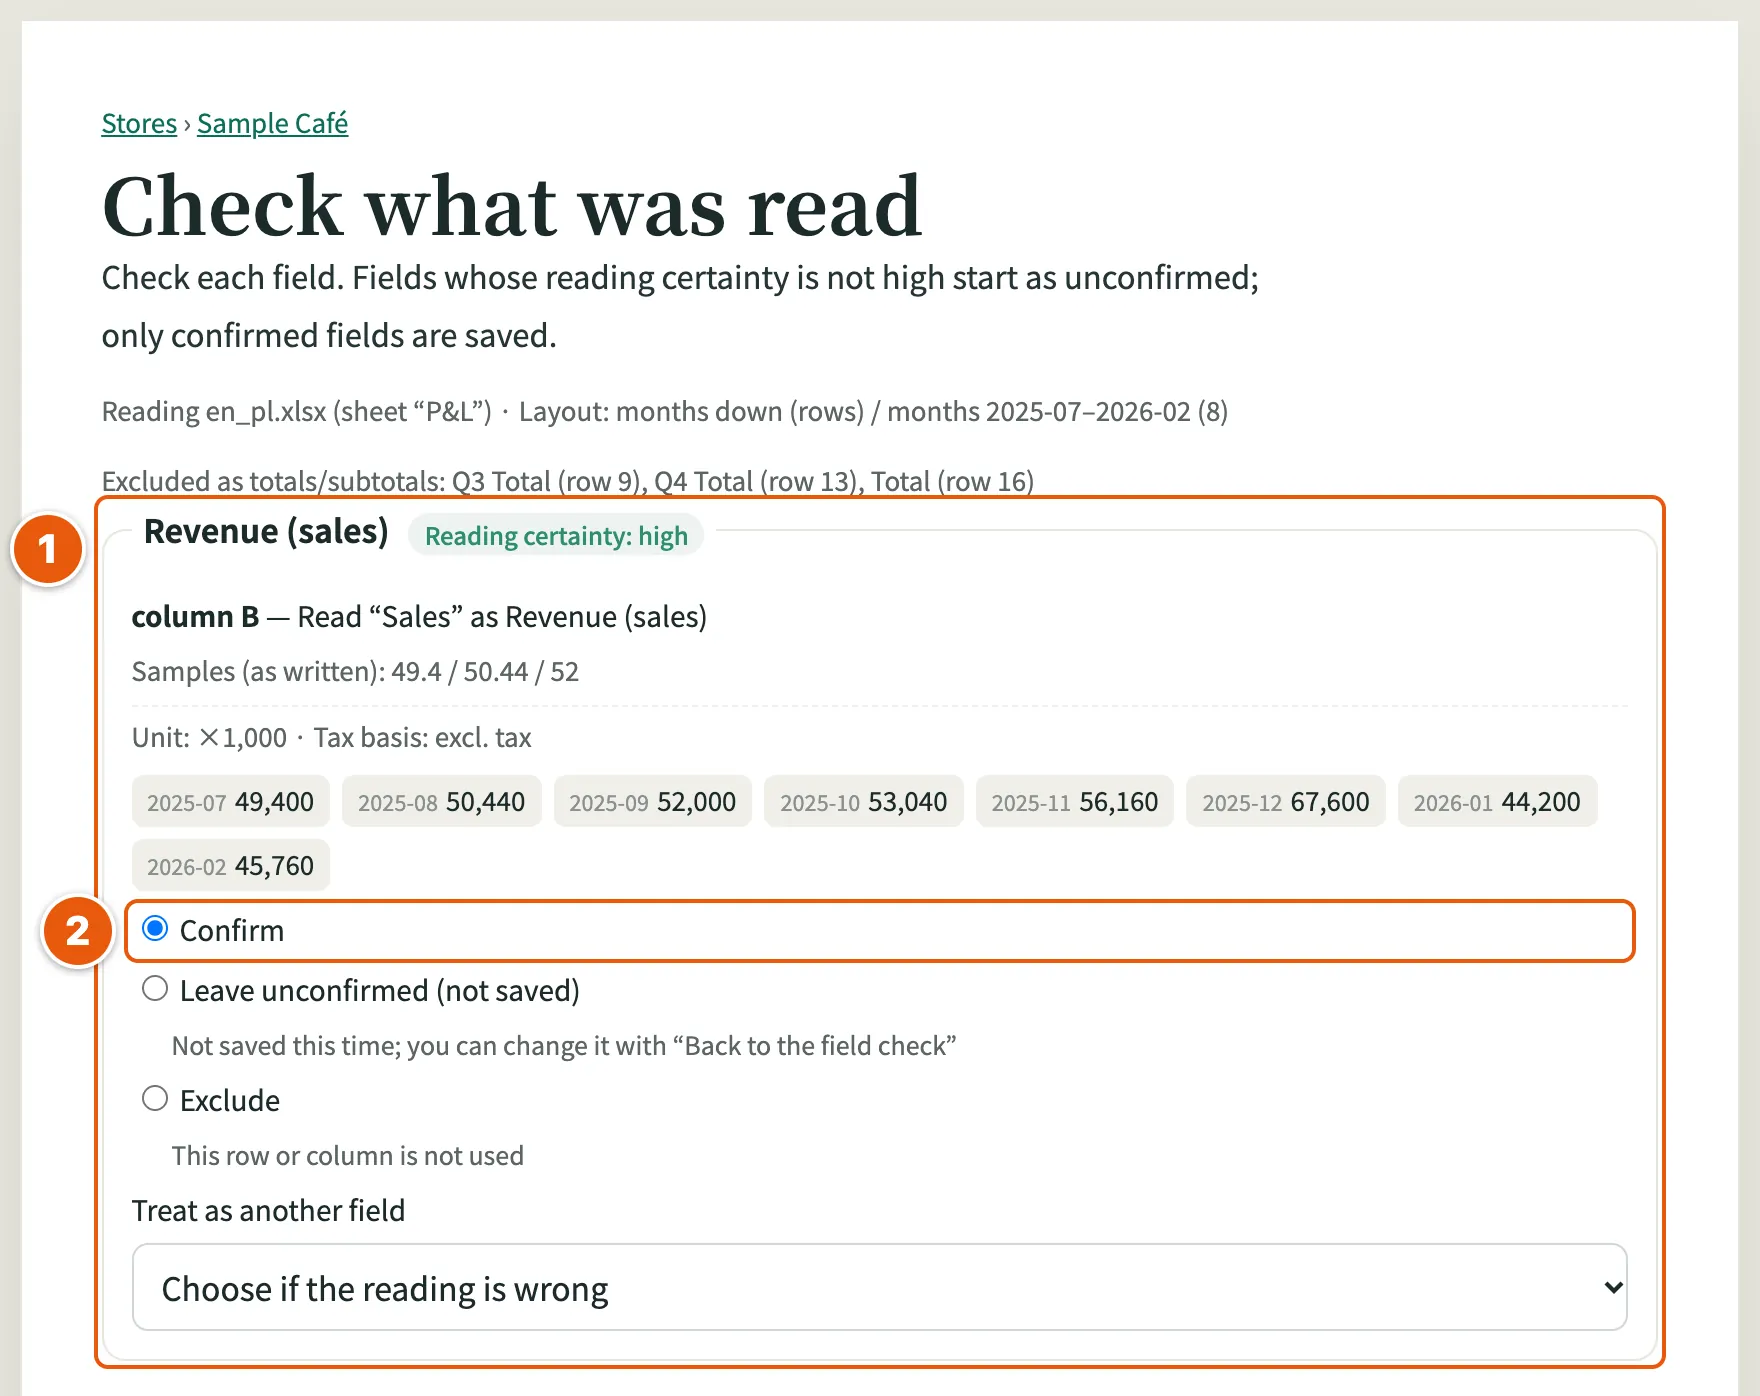
- What was read, field by field: which row or column of your file was read as this field, and its figure for each month. Fields without "Reading certainty: high" start as unconfirmed, so check those closely.
- "Confirm": choose it for each field that was read correctly. Only confirmed fields are saved.
- If a reading is wrong: pick the right field under "Treat as another field" for that field.
- If one line looks like the total of other lines: adding a total line and its detail lines together would count the same money twice, so the field asks whether to use the total line only or to add up the detail lines. Choose one, then "Confirm". Until you choose, that field is not saved. A field made of several lines names the lines it adds together.
- To leave it out: choose "Leave unconfirmed (not saved)" (not saved this time; you can change it with "Back to the field check") or "Exclude" (that row or column is not used).
- If a row or column of your file was not read as any field: choose one with "Assign to" under "Excluded or unrecognised rows/columns".
- A month with no figures: not read in. Figures already saved for that month do not change.
When every field is checked, press "Review what will be saved" at the bottom of the page to go to the check before saving.
Correct a mistake
Use "View or edit all months", pick the month, enter the right numbers, press "Review", then "Save". Earlier changes are listed under "Change history".
Reports you already made don't change. To see a report with the corrected numbers, create that month's report again (chapter 3).
To add an earlier month you have not entered, use a button such as "+ Earlier month (2025-03)" on the same screen, or pick the month under "Enter another month" and press "Open". If a month in between is left out, the check before saving names it.
Delete one month of data
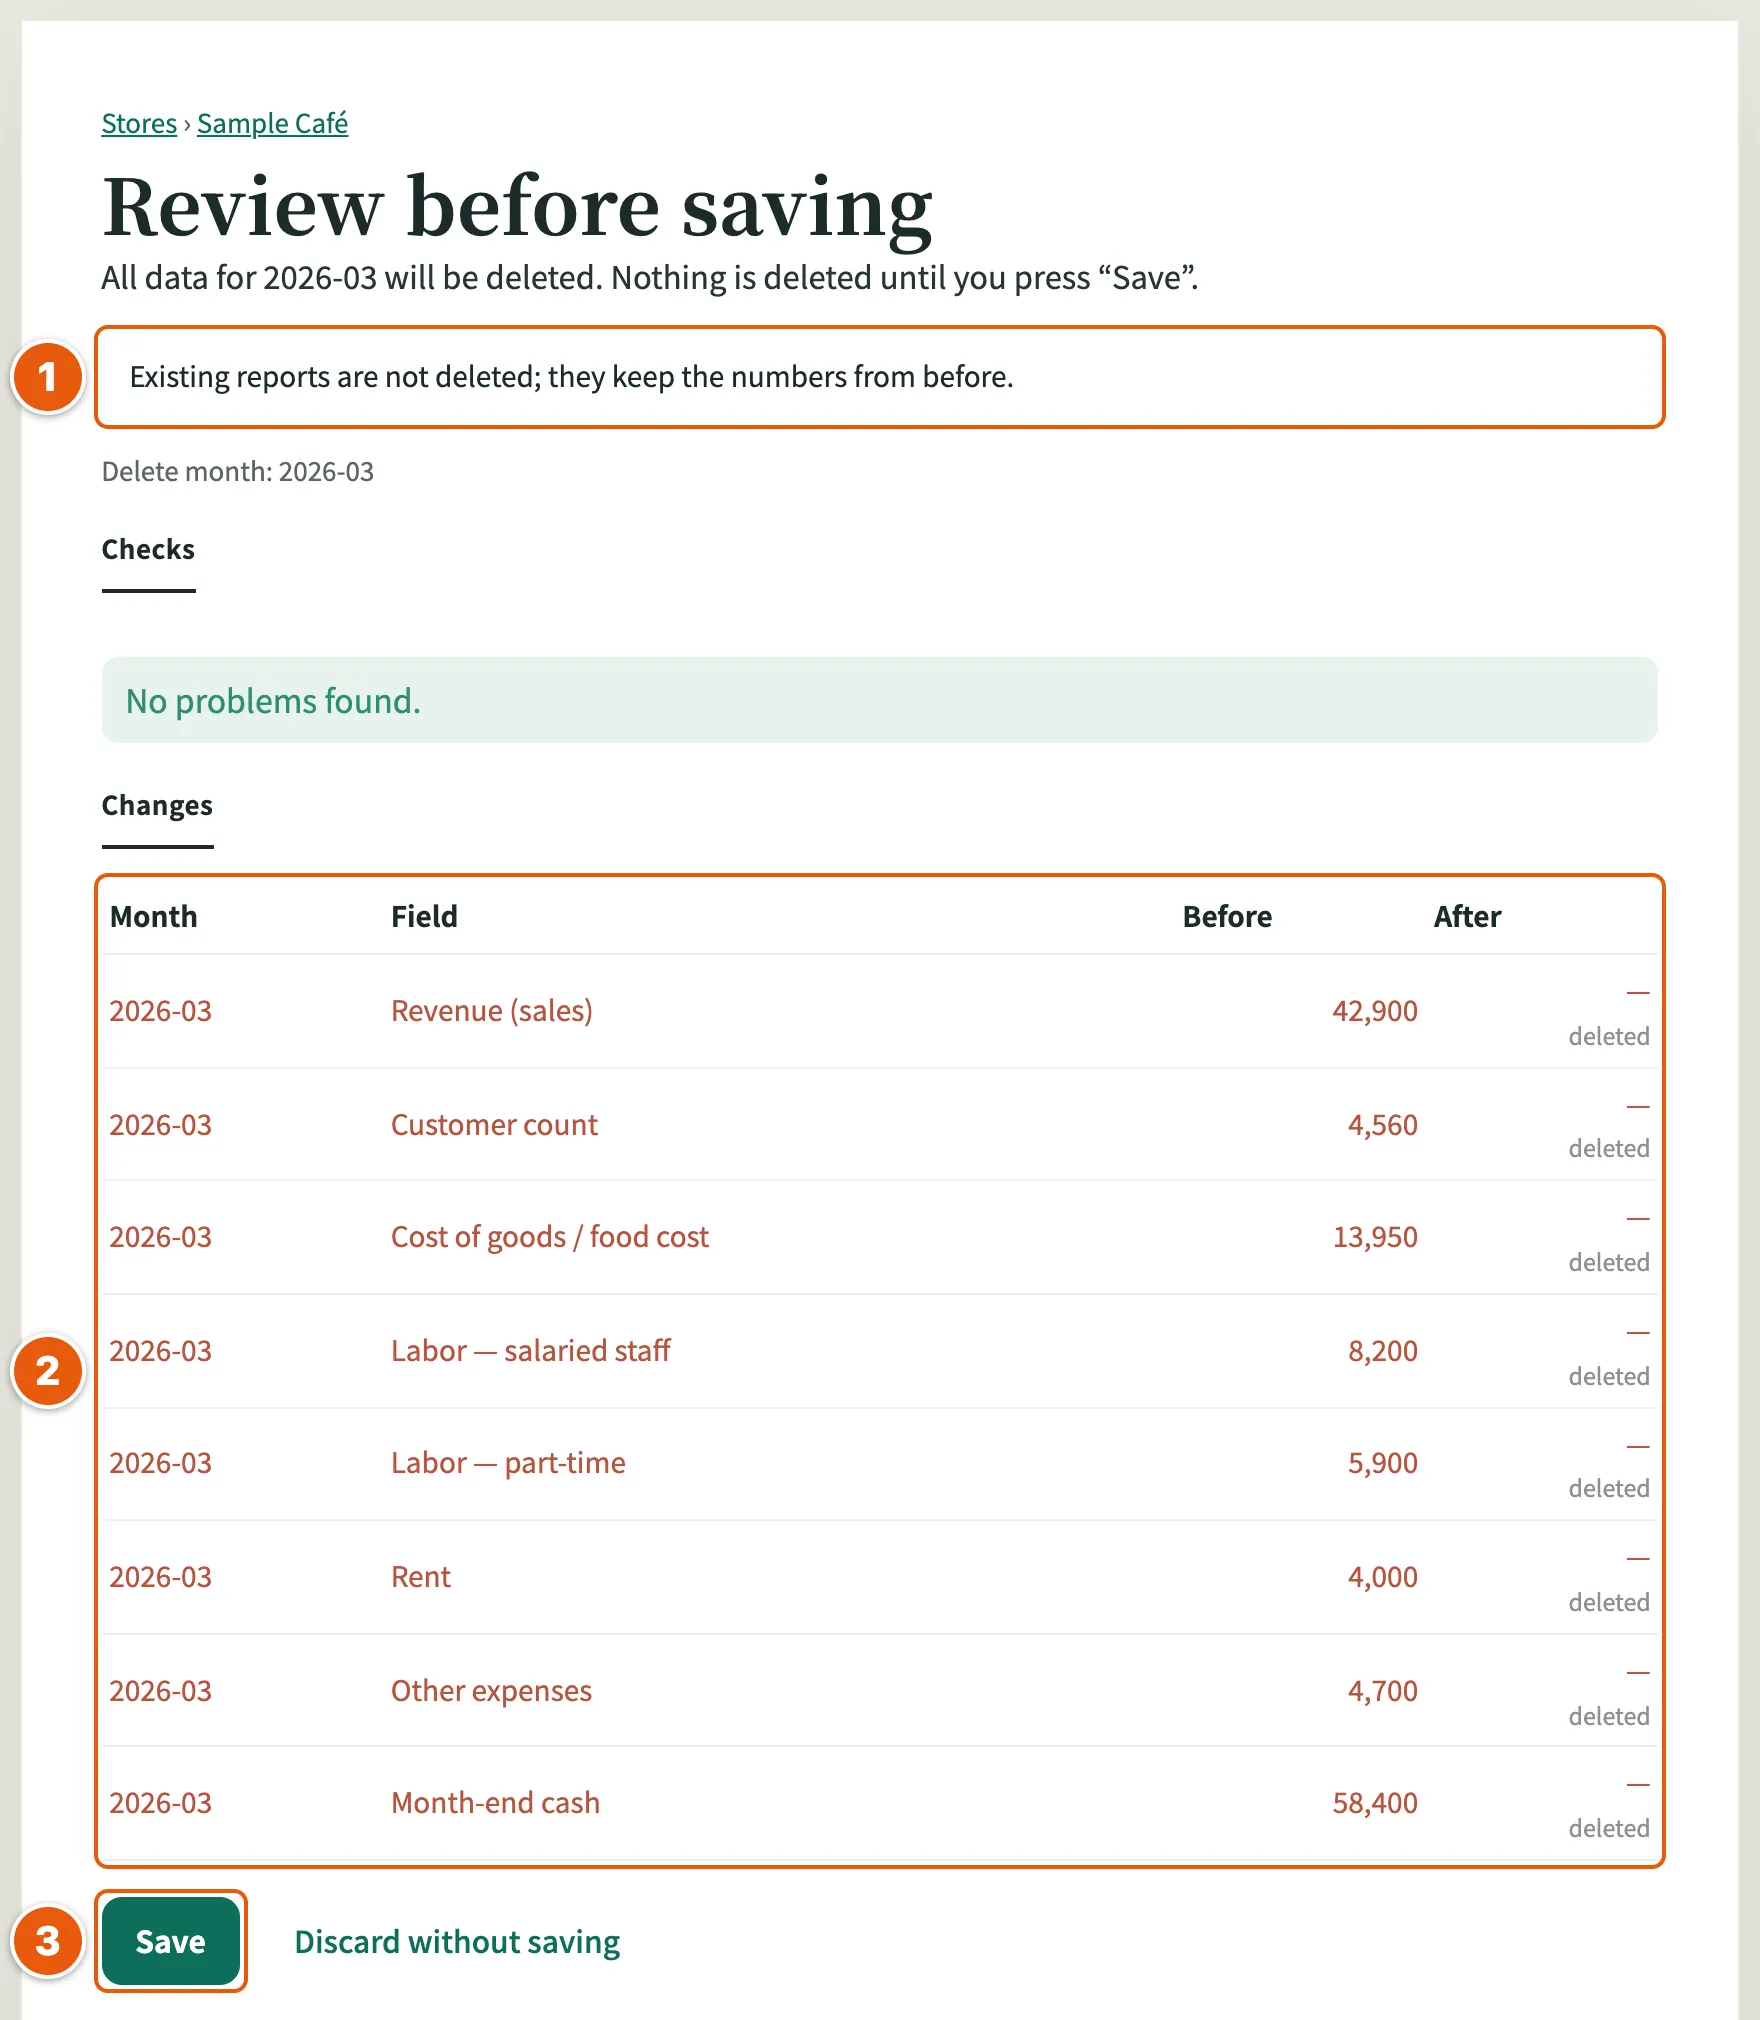
- "Existing reports are not deleted; they keep the numbers from before.": reports you already made stay as they are.
- "Changes": every value of that month that will be removed.
- "Save": the month is removed only when you press it. To stop, press "Discard without saving".
In "View or edit all months", press "Delete this month" for the month you want to remove to get here. The deletion is listed in "Change history".
If you delete a month in the middle, comparisons across it (with the previous month, trends) are not shown.
Blanks and deleting
A blank cell keeps the saved value. To remove a saved value, tick "delete" next to it.
Entering 0 saves 0. For a month without data, leave the cell blank rather than entering 0.
Cells with only − or — (import)
If your spreadsheet has cells with only − or —, you are asked how to treat them. "As blank (no data)" treats them as missing; "As 0" saves them as 0.
Export your data

- "Export your data to Excel": downloads an Excel file with this store's fields and every month you entered. Extra data that is turned off is included too if figures are saved. It is the same file as "Download the template".
You can read this file into another store with "Import your own spreadsheet". Extra data (such as month-end cash) is not turned on by reading it in; only the figures are saved. Turn it on in "Store settings" to use it.
3. Create a report
How
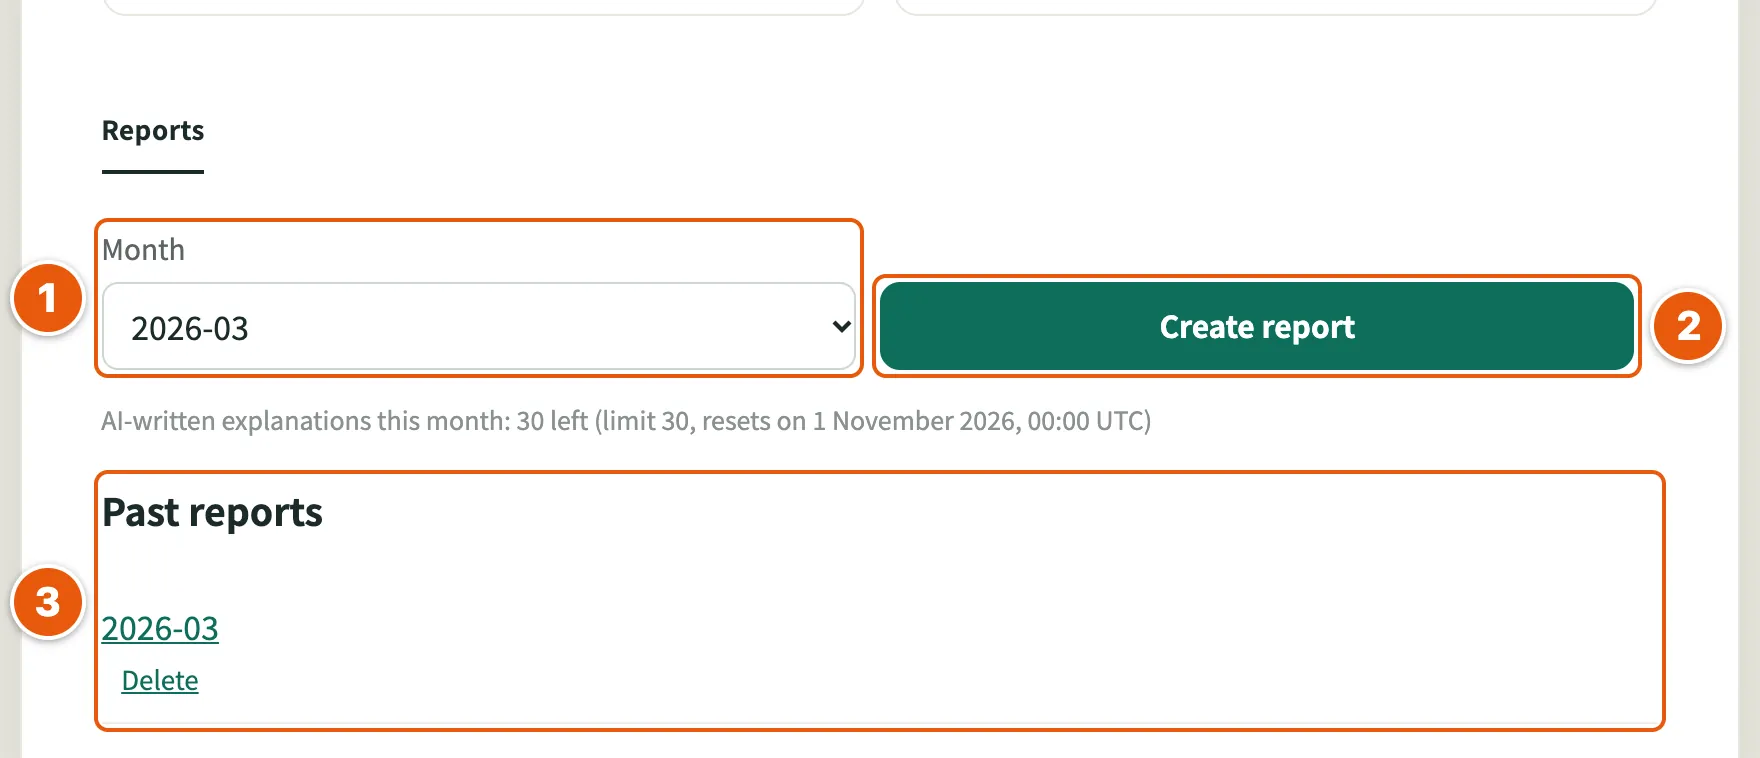
- "Month": the month to report on.
- "Create report": creates the report. Writing the explanation can take a minute or two; keep the page open.
- "Past reports": your reports are listed here.
In a report, "Download HTML" saves it as a file.
Save a report as PDF

- "Save as PDF": downloads the report you are viewing as a PDF file. While it is being made (a few seconds), the button says "Creating PDF…".
Each page ends with the store name, month, issue date, page number and "This report is reference information for business decisions, not accounting or tax advice." The paper is A4 or US Letter, depending on the store's country.
When a report for the month exists
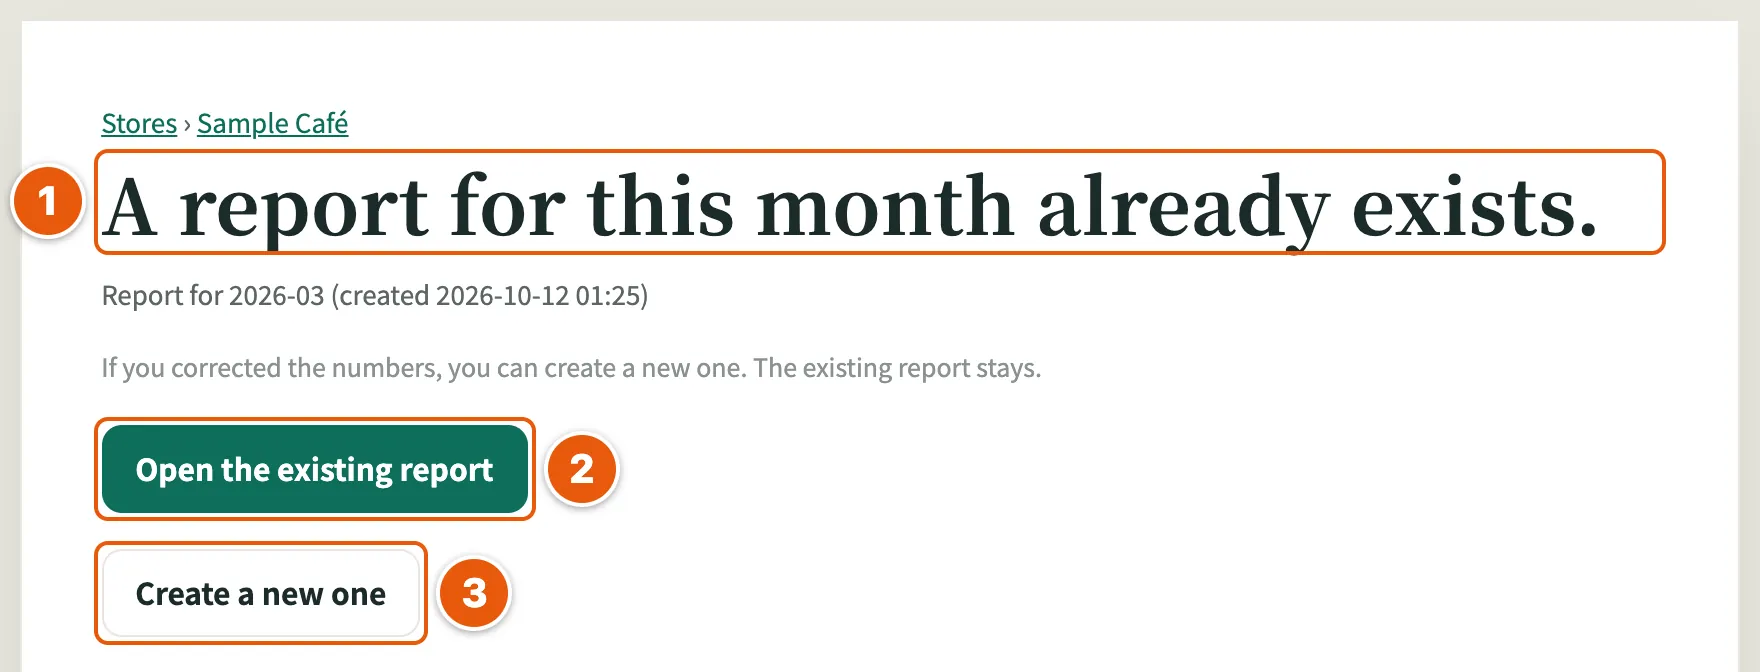
- "A report for this month already exists.": shown when you press "Create report" for a month that already has a report.
- "Open the existing report": opens the newest report for that month.
- "Create a new one": makes a new report, for example after you corrected the numbers. The existing report stays.
When a month has several reports, "Past reports" shows when each was created.
When it says basic explanation
If the written explanation could not be generated, the report shows a template filled with the calculated figures and is marked "basic explanation". The figures are the same as in a full report.
Press "Write the explanation again" above the report to try the text again. It uses the numbers from when that report was made.
When it says earlier method
When the calculation method is updated, reports made before are marked "earlier method". Open the report and press "Re-create" to recalculate the numbers it was made from with the current method. The original report stays under "Past reports".
Delete a report
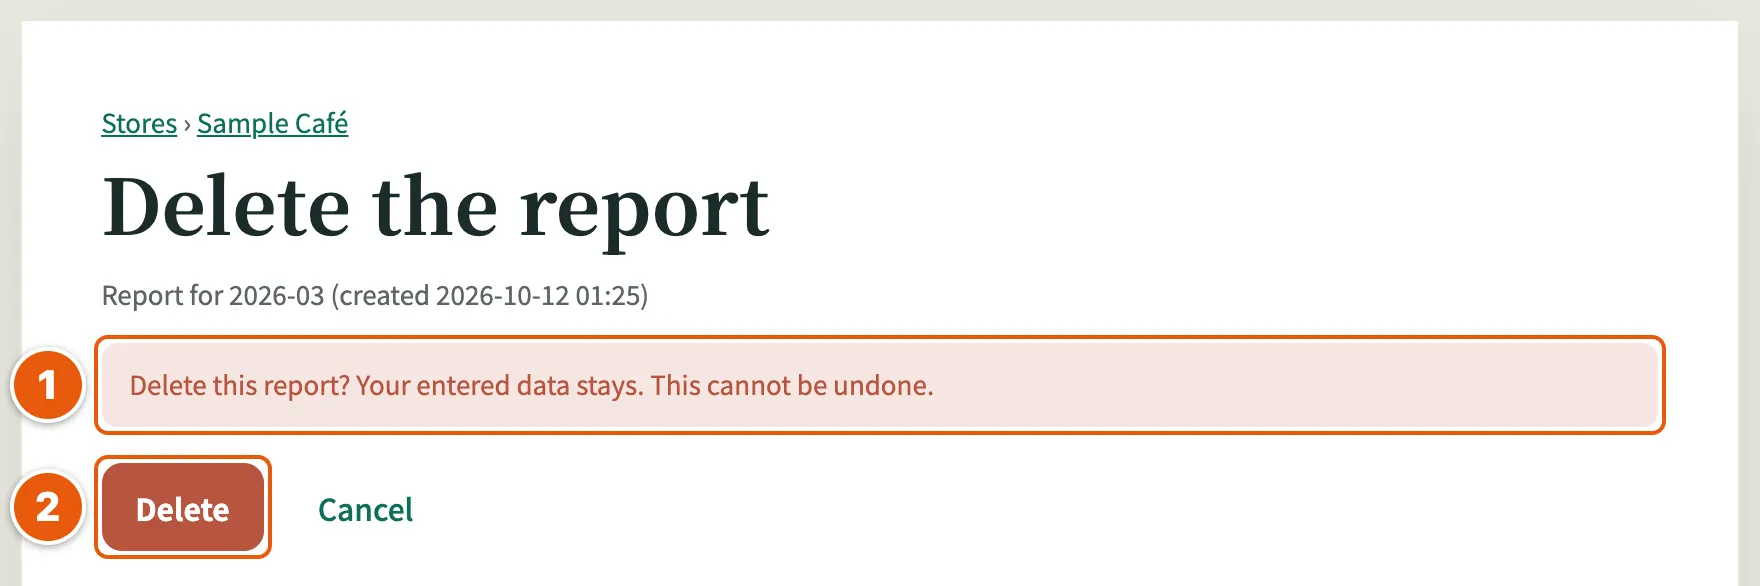
- "Delete this report? Your entered data stays. This cannot be undone.": only the report is deleted.
- "Delete": deletes the report.
Open it with "Delete" in "Past reports" or at the top of a report. Reports of demo stores cannot be deleted.
4. Read your report
Verdict and summary
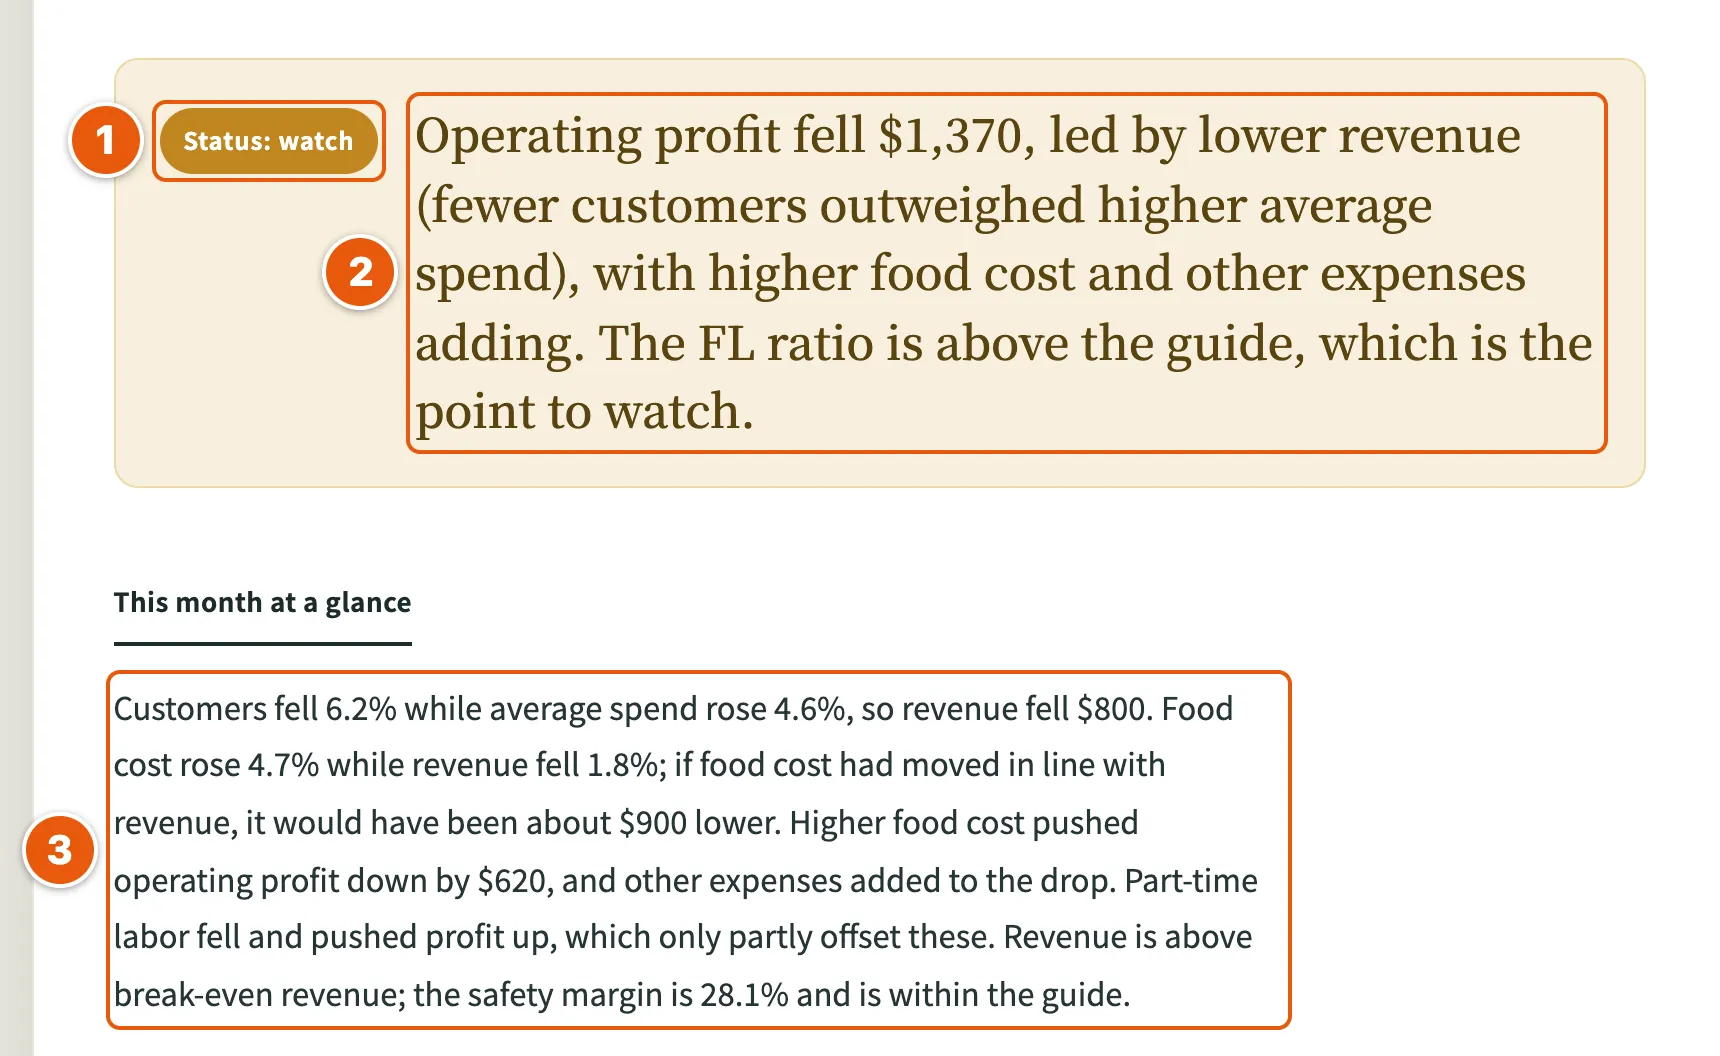
- Status: "Status: healthy", "Status: watch" or "Status: act now".
- A one-line summary of the month.
- "This month at a glance": its explanation.
Figure cards and colour dots
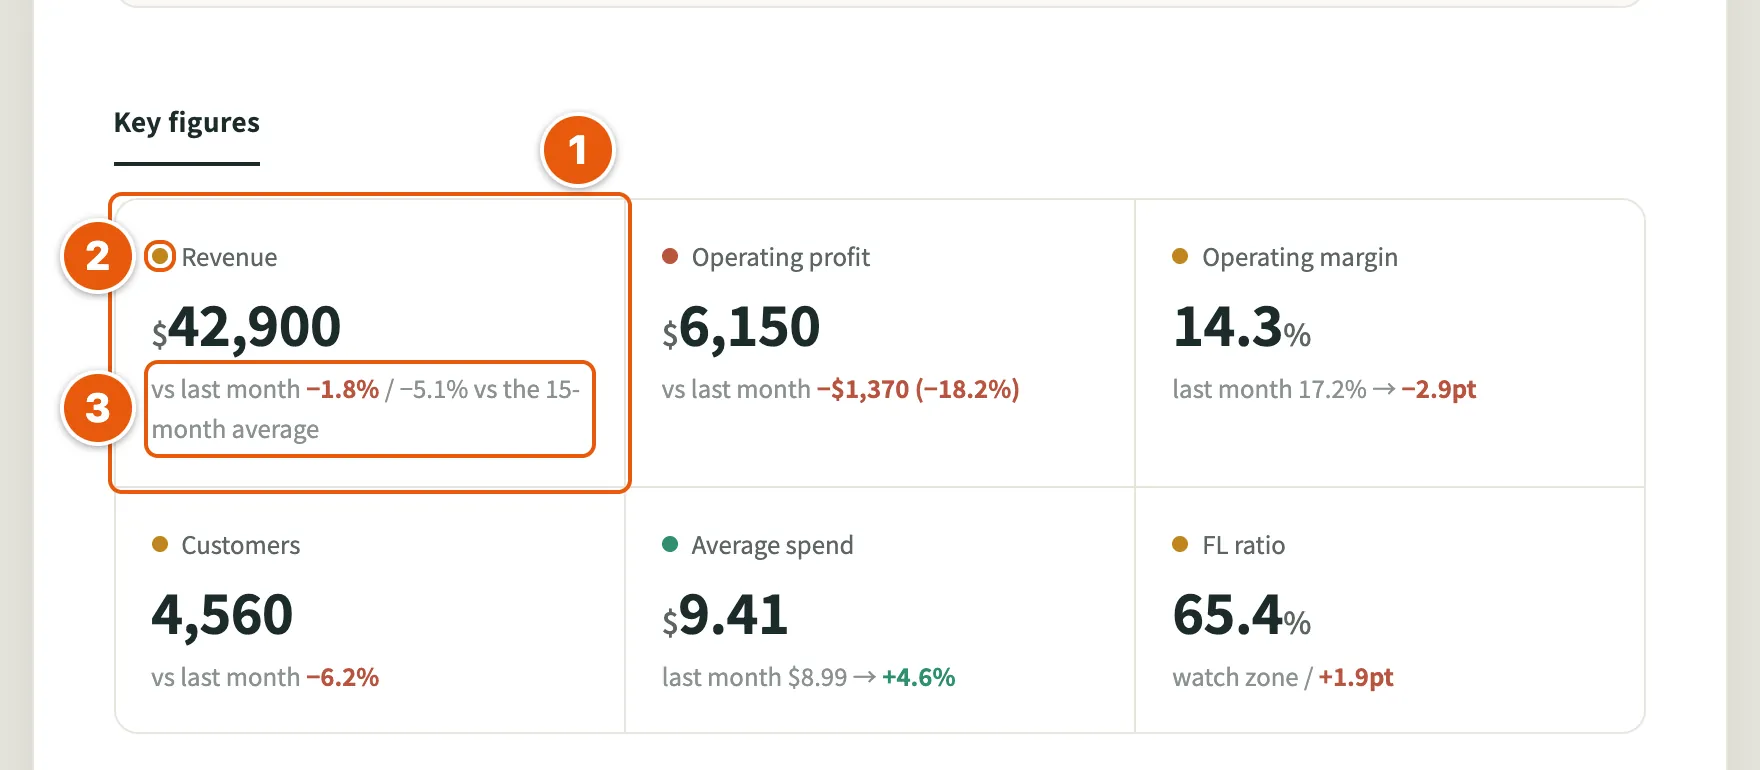
- A figure card: "Key figures" shows cards such as revenue and operating profit.
- Colour dot: shows the status. Green is healthy, amber is watch, red is act now. A card without a dot has nothing to compare against yet.
- Comparison with last month: appears once you have two months of data.
Provisional benchmark
A "provisional benchmark" is a general guide for your industry, set as a provisional value. You can replace it with your own under "Your own benchmarks (replace provisional ones)" in "Store settings".
Change in profit
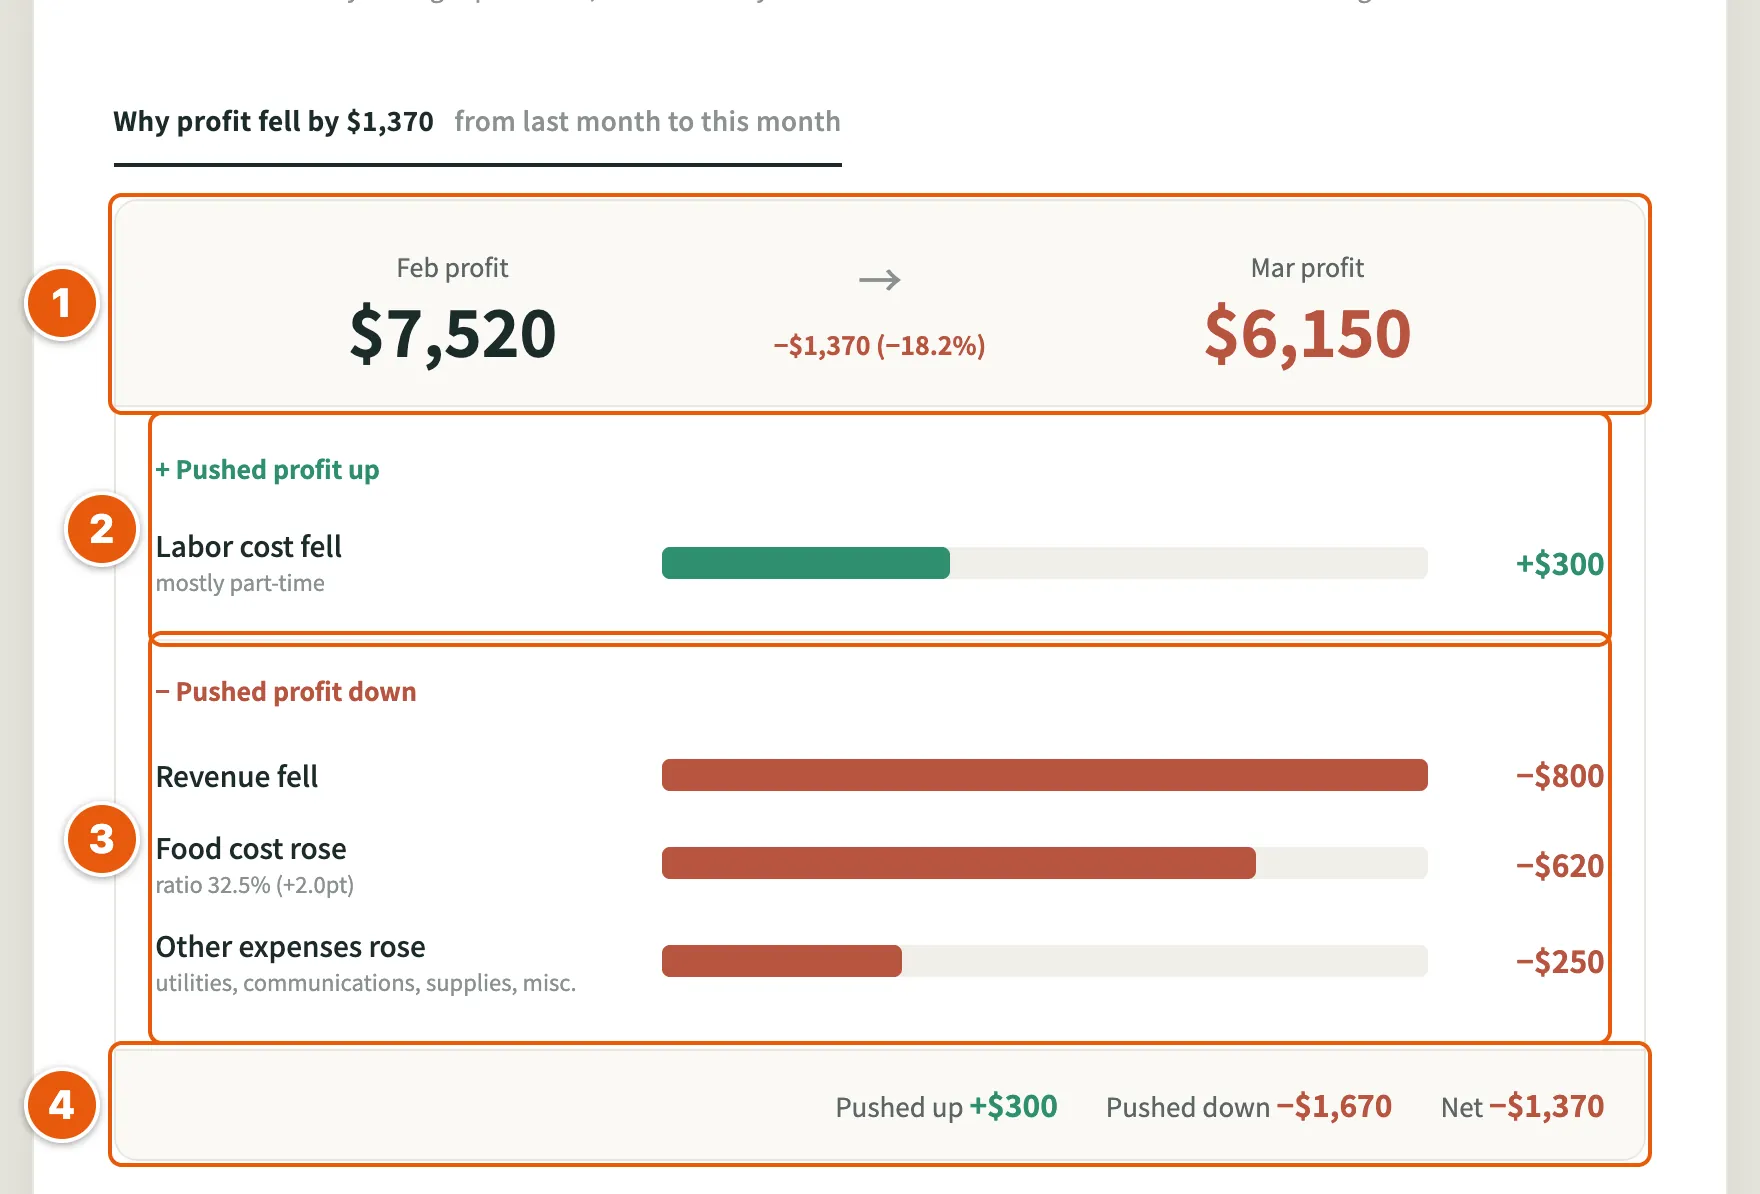
- Operating profit last month and this month.
- "+ Pushed profit up": the items that raised profit, with amounts.
- "− Pushed profit down": the items that lowered profit, with amounts.
- "Pushed up", "Pushed down" and "Net": the totals and the difference.
It needs two months of data.
Break-even and safety margin
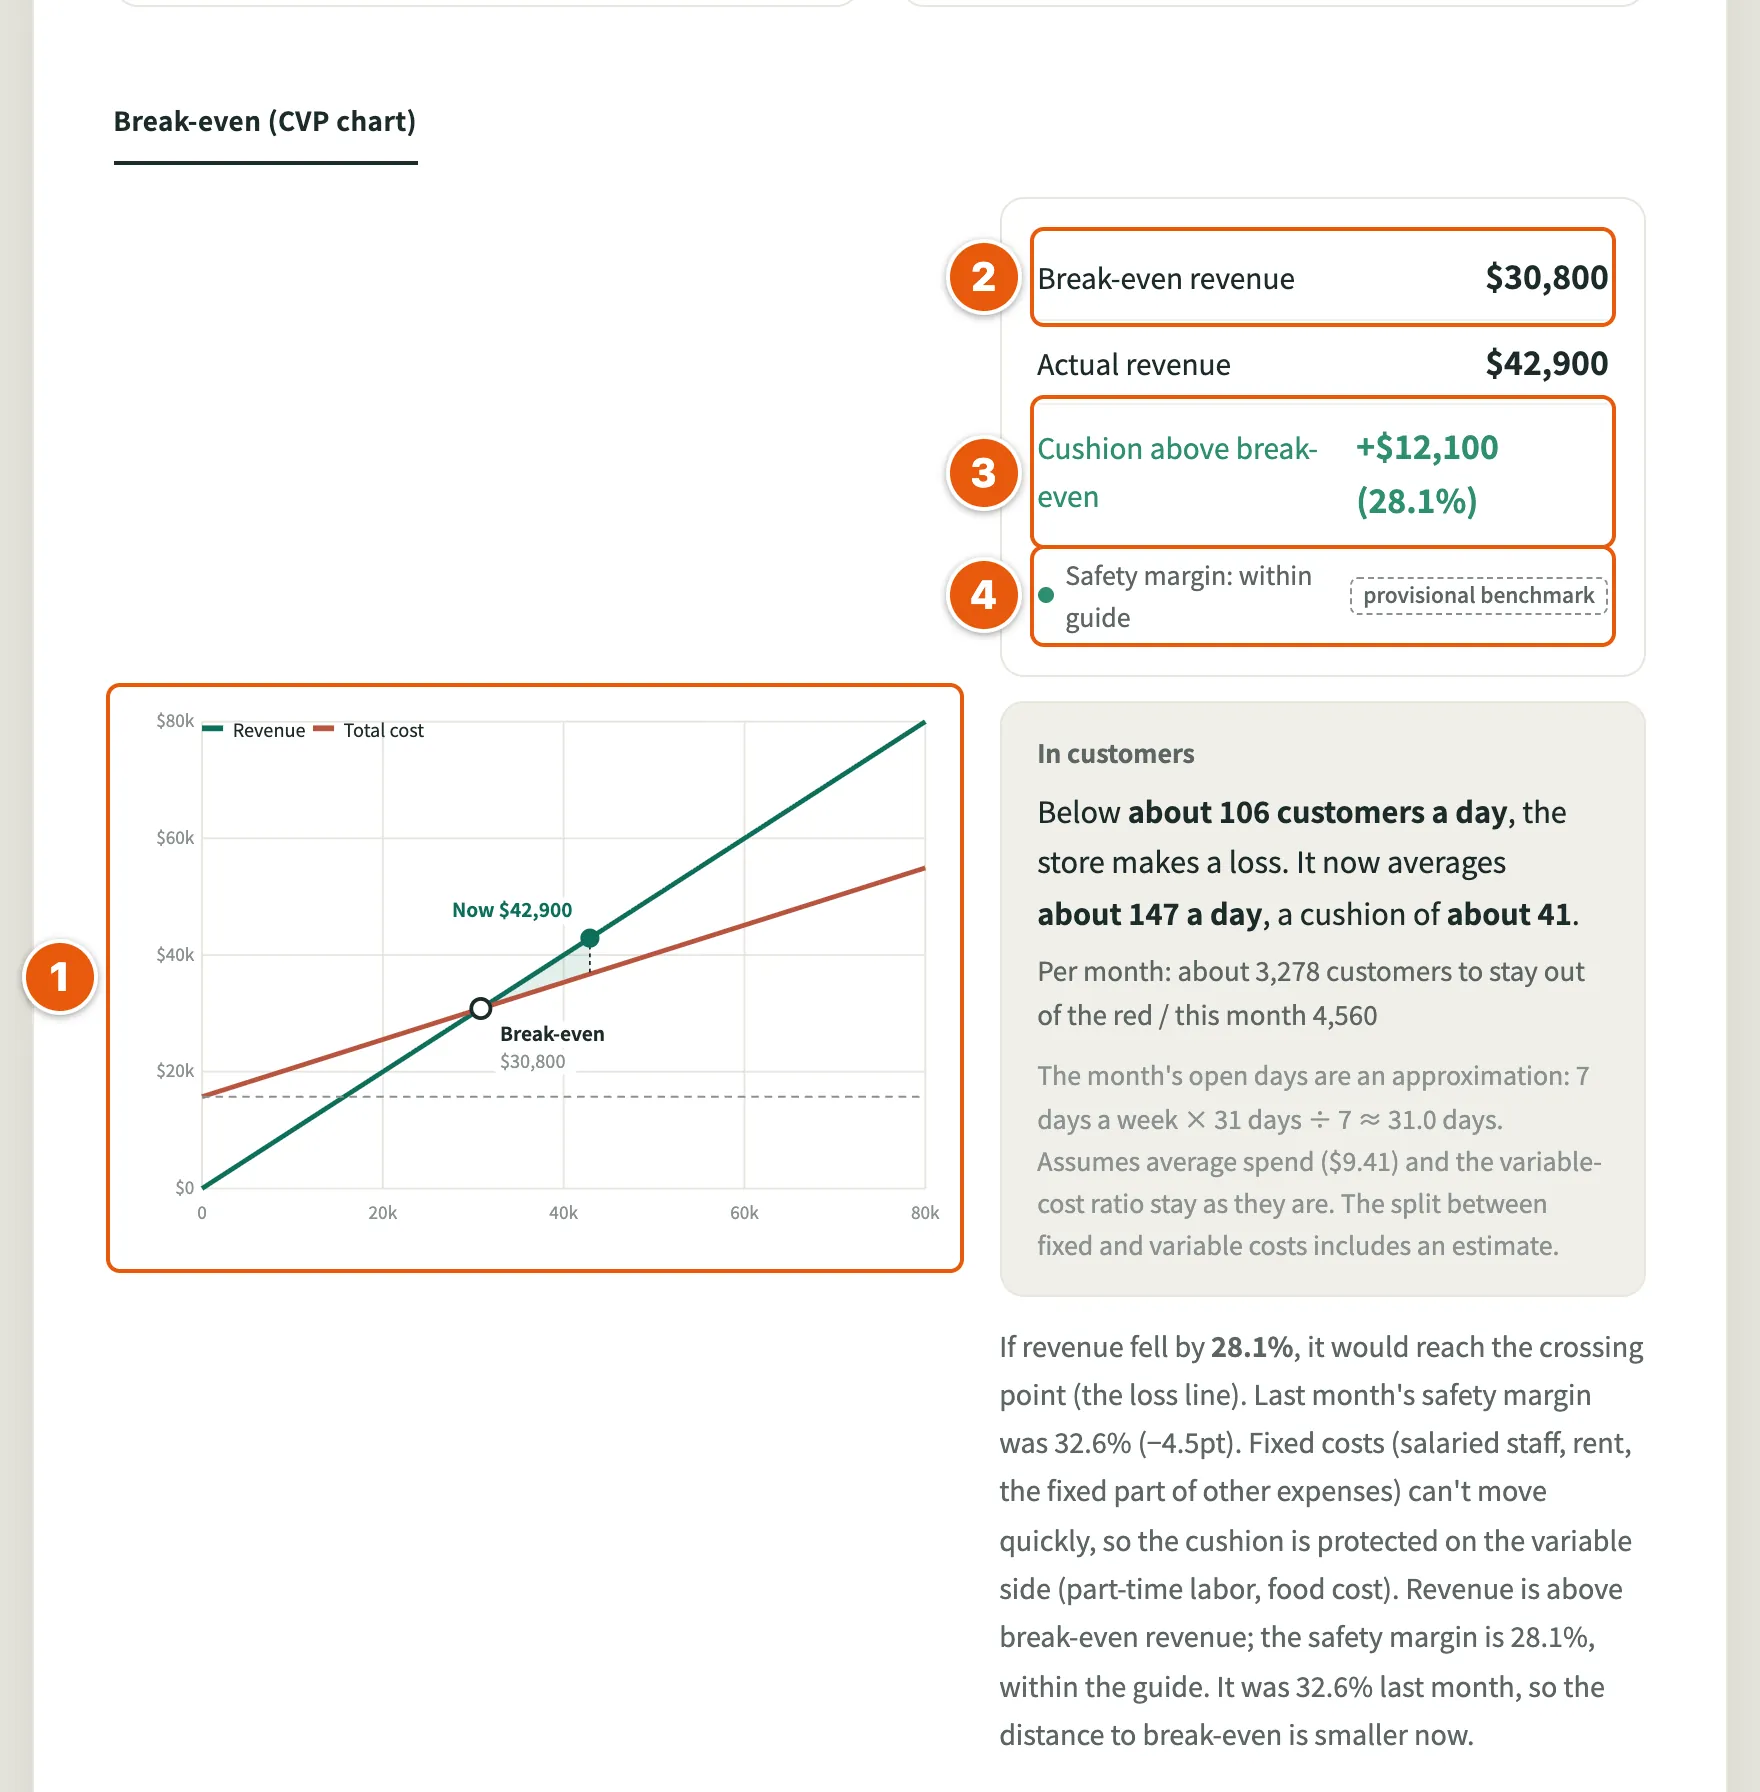
- The chart: where the revenue and total-cost lines cross is the break-even point, where the business neither loses nor makes money.
- "Break-even revenue": the revenue at that point.
- "Cushion above break-even": how far revenue could fall before reaching it (the safety margin), in money and %. Its colour follows the safety margin's zone: green, amber or red.
- Safety margin zone: "within guide", "watch zone" or "danger zone".
If you enter customers, the break-even point is also shown in customers.
Cash at month end
Shown when month-end cash is turned on under "Extra data (optional)" and entered.
- Month-end cash: the balance you entered.
- Months of average total expenses: month-end cash divided by the average monthly total expenses of the latest months (up to three). The months used and what counts as total expenses are stated right below it. It is a yardstick based on your usual monthly total expenses, not a forecast.
- Colour and words: three months or more is "within guide", one to three months "watch zone", below one month "danger zone". These bounds are a "provisional benchmark"; you can replace them with your own in "Store settings".
- From two months on, the change from the previous month is shown next to operating profit. The difference is "Money in and out besides operating profit": it includes things such as taxes, loans and repayments, owner withdrawals, equipment purchases and the timing of payments, but the app cannot tell what it consists of.
Sales by time of day
Shown when sales by time of day is turned on under "Extra data (optional)" and entered.
- For each time slot: sales, its share of sales and its share of opening hours.
- "Sales per hour vs. average": the share of sales divided by the share of opening hours. 1.0 means sales in line with the hours a slot is open; above 1.0, more sales per opening hour.
- "Per opening hour": shown when the days open per week are set; the slot's sales divided by its hours and the month's open days, an approximation.
- Changes from the previous month and, from three months on, each month's shares are shown. If the time slots were changed, only months with the same time slots are compared.
- These are monthly totals, so differences between days of the week do not show. Customers and staff hours are not included, so the report does not judge whether staffing fits.
Sales by item
Shown when sales by item is turned on under "Extra data (optional)" and entered (titled by menu item, product or service, depending on the industry).
- The named items in order of sales, with their share of sales and the cumulative share within the named items; "Other items" is the last row.
- Share is of total revenue; the cumulative figure is of the named items only, excluding other items. So the shares do not add up to the cumulative figure.
- Class: A until the cumulative share reaches 70%, B until 90%, C for the rest (the largest is always A). These are provisional benchmarks.
- Changes from last month are shown only for items that were also there last month.
- These are sales amounts only, so they do not show units sold, profit per item (no costs per item are entered) or why sales changed. The report does not judge what to charge or what to sell.
How complete is this report?
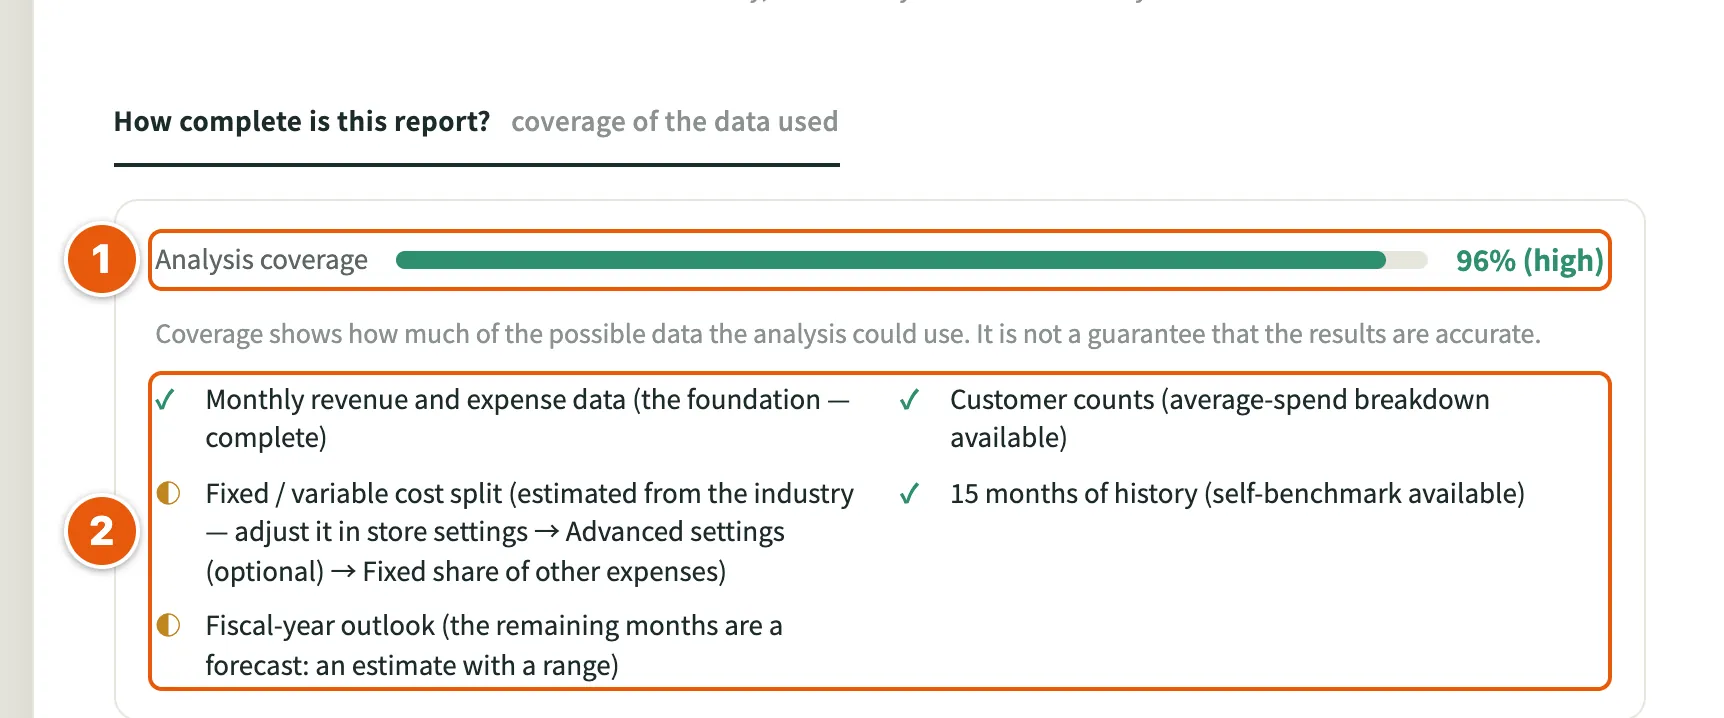
- "Analysis coverage": the share of the data the app accepts now that this report could use. It is not a guarantee that the results are accurate.
- The data used: ✓ is complete, ◐ is estimated or partial, — is not entered.
To bring it towards 100%:
- Under "Data you can enter" in "Store settings", tick everything you record and enter it every month.
- Enter your own "Fixed share of other expenses" under "Advanced settings (optional)".
- Keep adding months (12 months complete the history part).
"Data not used in this report" (shown only when one of them is off): for month-end cash, sales by time of day and sales by item that are not turned on, what recording them would show and where to add them. They are not part of the coverage score.
Month-end cash, sales by time of day and sales by item are listed on their own line under "Extra data (optional)" and are not part of the coverage score.
Actions for this month
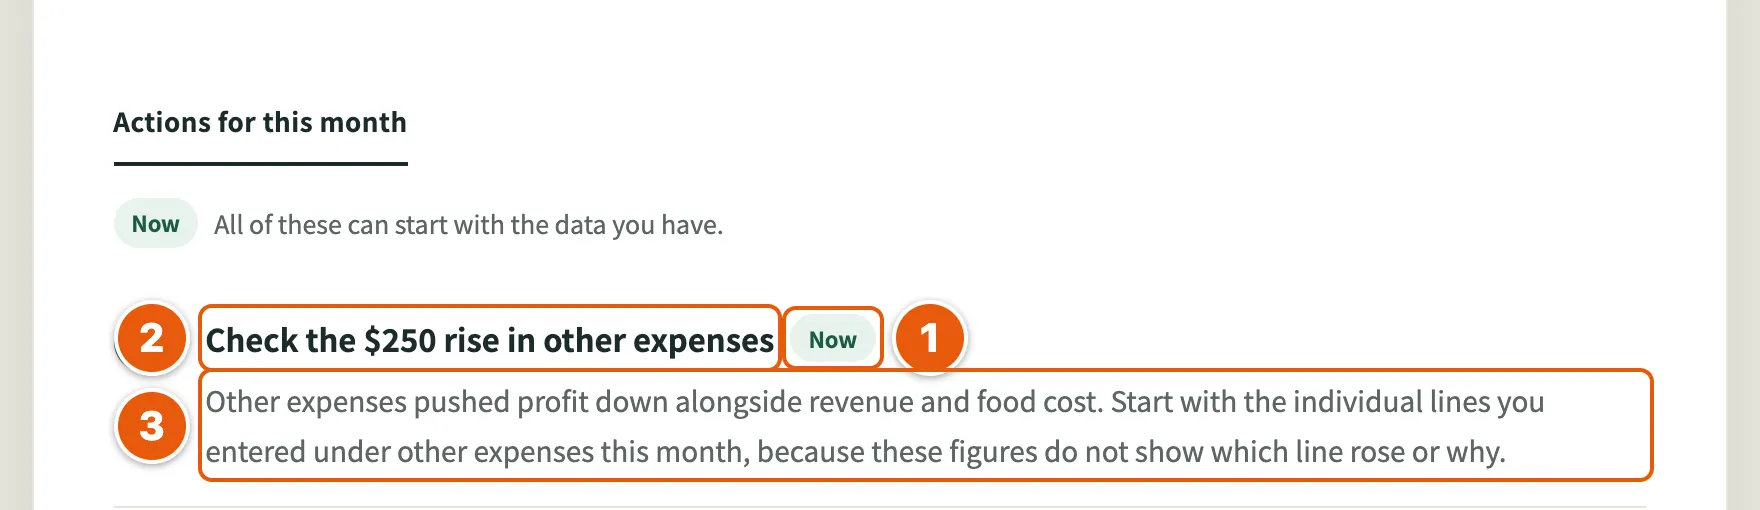
- "Now": every action can start with the data you have.
- Action title: what to work on this month.
- What the action says: why it matters and what to do first.
What the report is
The report is generated automatically from the data you entered, as a reference for management decisions. It is not accounting or tax advice.
5. Common questions
Can I enter a month that isn't over yet?
You can, but the report treats the numbers as the whole month, so comparisons with last month will look lower than they really are. It is best to enter a month once it has ended.
Should revenue include tax?
Either works, as long as you use the same basis every month. The app never adds or removes tax. If importing asks "Is revenue including or excluding tax?", answer as your spreadsheet shows; amounts are not converted.
I saved a mistake
Correct it with "View or edit all months" (chapter 2). To see a report with the corrected numbers, create that month's report again.
I don't record customers
You can still create reports. The customer and average-spend cards, the "What moved revenue" section, the break-even point in customers and the actions that use customers are left out. Once you start recording them, add customers under "Data you can enter" in "Store settings".
How many months do I need?
One month is enough to start; the report shows this month's levels.
- Two months: comparisons with last month, "Change in profit" and "What moved revenue" (if you enter customers).
- Three months or more: "Revenue trend", "Profit trend" and "Fiscal-year outlook".
- Twelve months: a full comparison with your own past (self-benchmark).